Subsaharan African vs Venezuelan Disability Age 18 to 34
COMPARE
Subsaharan African
Venezuelan
Disability Age 18 to 34
Disability Age 18 to 34 Comparison
Sub-Saharan Africans
Venezuelans
7.1%
DISABILITY AGE 18 TO 34
1.7/ 100
METRIC RATING
235th/ 347
METRIC RANK
5.8%
DISABILITY AGE 18 TO 34
99.9/ 100
METRIC RATING
34th/ 347
METRIC RANK
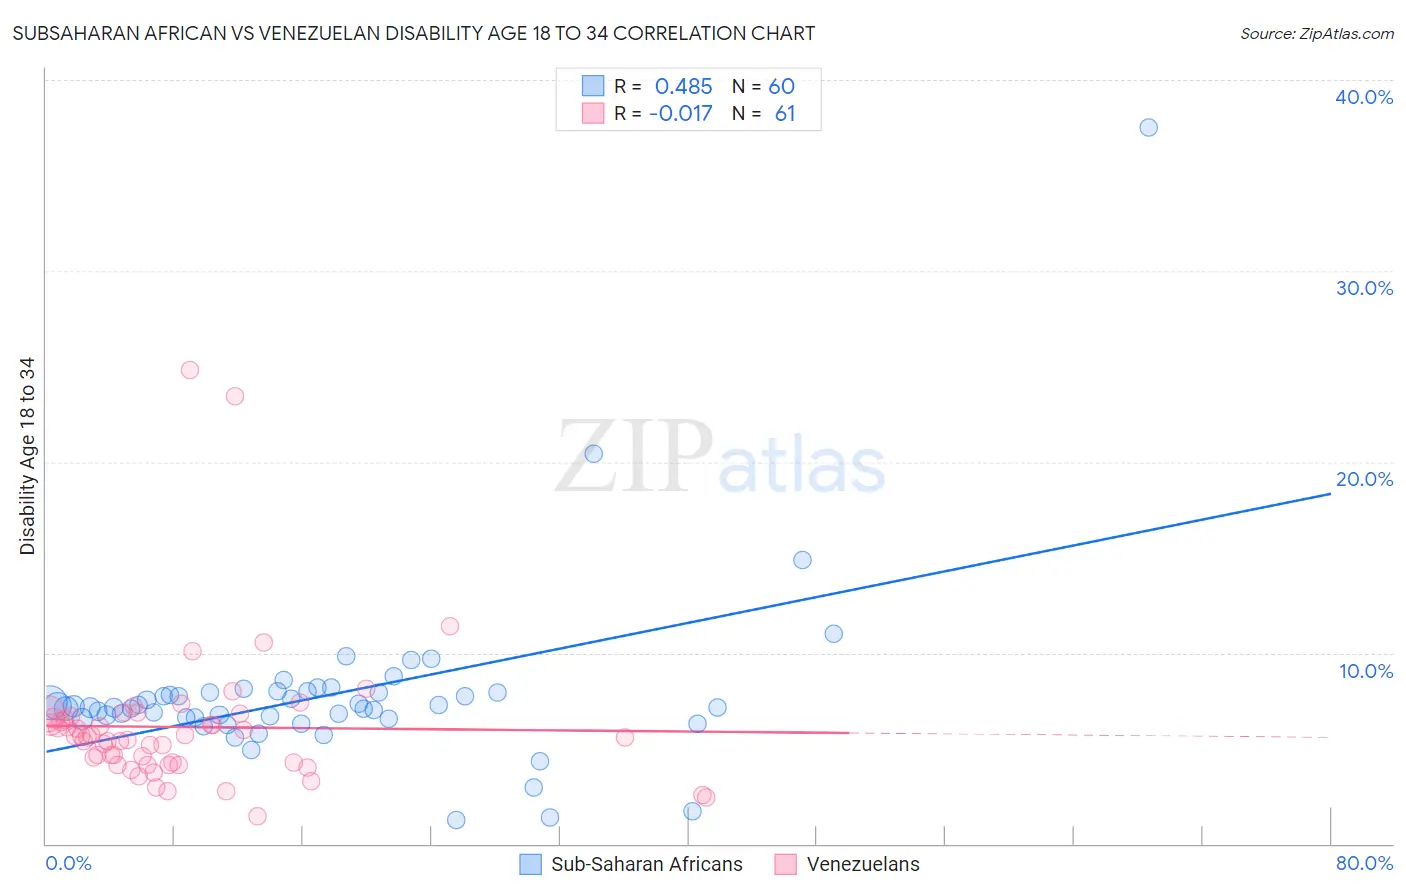
Subsaharan African vs Venezuelan Disability Age 18 to 34 Correlation Chart
The statistical analysis conducted on geographies consisting of 506,334,183 people shows a moderate positive correlation between the proportion of Sub-Saharan Africans and percentage of population with a disability between the ages 18 and 35 in the United States with a correlation coefficient (R) of 0.485 and weighted average of 7.1%. Similarly, the statistical analysis conducted on geographies consisting of 305,999,562 people shows no correlation between the proportion of Venezuelans and percentage of population with a disability between the ages 18 and 35 in the United States with a correlation coefficient (R) of -0.017 and weighted average of 5.8%, a difference of 22.1%.
Disability Age 18 to 34 Correlation Summary
| Measurement | Subsaharan African | Venezuelan |
| Minimum | 1.2% | 1.4% |
| Maximum | 37.5% | 24.8% |
| Range | 36.3% | 23.4% |
| Mean | 7.8% | 6.1% |
| Median | 7.1% | 5.6% |
| Interquartile 25% (IQ1) | 6.6% | 4.2% |
| Interquartile 75% (IQ3) | 7.9% | 6.6% |
| Interquartile Range (IQR) | 1.4% | 2.4% |
| Standard Deviation (Sample) | 4.7% | 3.8% |
| Standard Deviation (Population) | 4.7% | 3.8% |
Similar Demographics by Disability Age 18 to 34
Demographics Similar to Sub-Saharan Africans by Disability Age 18 to 34
In terms of disability age 18 to 34, the demographic groups most similar to Sub-Saharan Africans are Liberian (7.1%, a difference of 0.25%), Alsatian (7.0%, a difference of 0.37%), Austrian (7.1%, a difference of 0.42%), Marshallese (7.1%, a difference of 0.47%), and Italian (7.1%, a difference of 0.58%).
| Demographics | Rating | Rank | Disability Age 18 to 34 |
| Immigrants | Yemen | 4.2 /100 | #228 | Tragic 7.0% |
| Lithuanians | 4.1 /100 | #229 | Tragic 7.0% |
| Immigrants | North America | 3.9 /100 | #230 | Tragic 7.0% |
| Ute | 3.8 /100 | #231 | Tragic 7.0% |
| Samoans | 3.2 /100 | #232 | Tragic 7.0% |
| New Zealanders | 2.7 /100 | #233 | Tragic 7.0% |
| Alsatians | 2.1 /100 | #234 | Tragic 7.0% |
| Sub-Saharan Africans | 1.7 /100 | #235 | Tragic 7.1% |
| Liberians | 1.5 /100 | #236 | Tragic 7.1% |
| Austrians | 1.3 /100 | #237 | Tragic 7.1% |
| Marshallese | 1.3 /100 | #238 | Tragic 7.1% |
| Italians | 1.2 /100 | #239 | Tragic 7.1% |
| Arapaho | 1.1 /100 | #240 | Tragic 7.1% |
| Nepalese | 1.1 /100 | #241 | Tragic 7.1% |
| Immigrants | Congo | 1.1 /100 | #242 | Tragic 7.1% |
Demographics Similar to Venezuelans by Disability Age 18 to 34
In terms of disability age 18 to 34, the demographic groups most similar to Venezuelans are Argentinean (5.8%, a difference of 0.19%), Iranian (5.8%, a difference of 0.21%), Immigrants from Barbados (5.8%, a difference of 0.21%), Immigrants from Lithuania (5.8%, a difference of 0.22%), and Ecuadorian (5.8%, a difference of 0.38%).
| Demographics | Rating | Rank | Disability Age 18 to 34 |
| Immigrants | Venezuela | 99.9 /100 | #27 | Exceptional 5.7% |
| Soviet Union | 99.9 /100 | #28 | Exceptional 5.7% |
| Immigrants | Ecuador | 99.9 /100 | #29 | Exceptional 5.7% |
| Immigrants | Pakistan | 99.9 /100 | #30 | Exceptional 5.8% |
| Iranians | 99.9 /100 | #31 | Exceptional 5.8% |
| Immigrants | Barbados | 99.9 /100 | #32 | Exceptional 5.8% |
| Argentineans | 99.9 /100 | #33 | Exceptional 5.8% |
| Venezuelans | 99.9 /100 | #34 | Exceptional 5.8% |
| Immigrants | Lithuania | 99.9 /100 | #35 | Exceptional 5.8% |
| Ecuadorians | 99.9 /100 | #36 | Exceptional 5.8% |
| Armenians | 99.9 /100 | #37 | Exceptional 5.8% |
| Immigrants | South America | 99.9 /100 | #38 | Exceptional 5.8% |
| Asians | 99.9 /100 | #39 | Exceptional 5.8% |
| Bolivians | 99.9 /100 | #40 | Exceptional 5.8% |
| Nicaraguans | 99.9 /100 | #41 | Exceptional 5.8% |