Subsaharan African vs Scottish Disability Age 18 to 34
COMPARE
Subsaharan African
Scottish
Disability Age 18 to 34
Disability Age 18 to 34 Comparison
Sub-Saharan Africans
Scottish
7.1%
DISABILITY AGE 18 TO 34
1.7/ 100
METRIC RATING
235th/ 347
METRIC RANK
7.7%
DISABILITY AGE 18 TO 34
0.0/ 100
METRIC RATING
300th/ 347
METRIC RANK
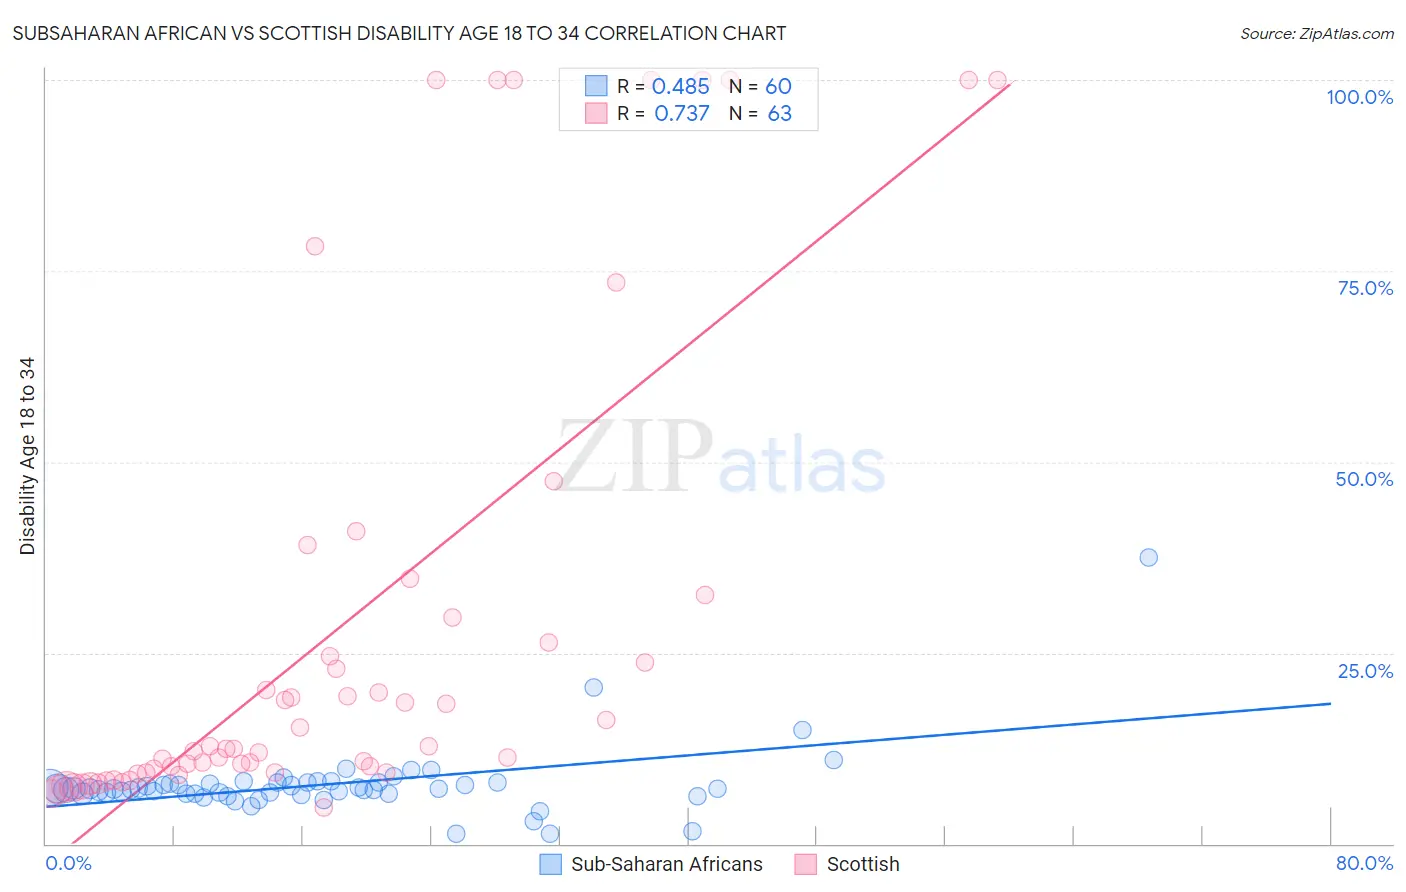
Subsaharan African vs Scottish Disability Age 18 to 34 Correlation Chart
The statistical analysis conducted on geographies consisting of 506,334,183 people shows a moderate positive correlation between the proportion of Sub-Saharan Africans and percentage of population with a disability between the ages 18 and 35 in the United States with a correlation coefficient (R) of 0.485 and weighted average of 7.1%. Similarly, the statistical analysis conducted on geographies consisting of 561,209,610 people shows a strong positive correlation between the proportion of Scottish and percentage of population with a disability between the ages 18 and 35 in the United States with a correlation coefficient (R) of 0.737 and weighted average of 7.7%, a difference of 9.5%.
Disability Age 18 to 34 Correlation Summary
| Measurement | Subsaharan African | Scottish |
| Minimum | 1.2% | 4.8% |
| Maximum | 37.5% | 100.0% |
| Range | 36.3% | 95.2% |
| Mean | 7.8% | 28.0% |
| Median | 7.1% | 12.5% |
| Interquartile 25% (IQ1) | 6.6% | 9.3% |
| Interquartile 75% (IQ3) | 7.9% | 29.6% |
| Interquartile Range (IQR) | 1.4% | 20.3% |
| Standard Deviation (Sample) | 4.7% | 30.9% |
| Standard Deviation (Population) | 4.7% | 30.7% |
Similar Demographics by Disability Age 18 to 34
Demographics Similar to Sub-Saharan Africans by Disability Age 18 to 34
In terms of disability age 18 to 34, the demographic groups most similar to Sub-Saharan Africans are Liberian (7.1%, a difference of 0.25%), Alsatian (7.0%, a difference of 0.37%), Austrian (7.1%, a difference of 0.42%), Marshallese (7.1%, a difference of 0.47%), and Italian (7.1%, a difference of 0.58%).
| Demographics | Rating | Rank | Disability Age 18 to 34 |
| Immigrants | Yemen | 4.2 /100 | #228 | Tragic 7.0% |
| Lithuanians | 4.1 /100 | #229 | Tragic 7.0% |
| Immigrants | North America | 3.9 /100 | #230 | Tragic 7.0% |
| Ute | 3.8 /100 | #231 | Tragic 7.0% |
| Samoans | 3.2 /100 | #232 | Tragic 7.0% |
| New Zealanders | 2.7 /100 | #233 | Tragic 7.0% |
| Alsatians | 2.1 /100 | #234 | Tragic 7.0% |
| Sub-Saharan Africans | 1.7 /100 | #235 | Tragic 7.1% |
| Liberians | 1.5 /100 | #236 | Tragic 7.1% |
| Austrians | 1.3 /100 | #237 | Tragic 7.1% |
| Marshallese | 1.3 /100 | #238 | Tragic 7.1% |
| Italians | 1.2 /100 | #239 | Tragic 7.1% |
| Arapaho | 1.1 /100 | #240 | Tragic 7.1% |
| Nepalese | 1.1 /100 | #241 | Tragic 7.1% |
| Immigrants | Congo | 1.1 /100 | #242 | Tragic 7.1% |
Demographics Similar to Scottish by Disability Age 18 to 34
In terms of disability age 18 to 34, the demographic groups most similar to Scottish are German (7.7%, a difference of 0.010%), Pima (7.7%, a difference of 0.060%), Welsh (7.7%, a difference of 0.14%), Cheyenne (7.7%, a difference of 0.20%), and Dutch (7.7%, a difference of 0.25%).
| Demographics | Rating | Rank | Disability Age 18 to 34 |
| Scandinavians | 0.0 /100 | #293 | Tragic 7.7% |
| Immigrants | Cabo Verde | 0.0 /100 | #294 | Tragic 7.7% |
| Tlingit-Haida | 0.0 /100 | #295 | Tragic 7.7% |
| Cape Verdeans | 0.0 /100 | #296 | Tragic 7.7% |
| Pueblo | 0.0 /100 | #297 | Tragic 7.7% |
| Dutch | 0.0 /100 | #298 | Tragic 7.7% |
| Germans | 0.0 /100 | #299 | Tragic 7.7% |
| Scottish | 0.0 /100 | #300 | Tragic 7.7% |
| Pima | 0.0 /100 | #301 | Tragic 7.7% |
| Welsh | 0.0 /100 | #302 | Tragic 7.7% |
| Cheyenne | 0.0 /100 | #303 | Tragic 7.7% |
| Shoshone | 0.0 /100 | #304 | Tragic 7.8% |
| Menominee | 0.0 /100 | #305 | Tragic 7.8% |
| English | 0.0 /100 | #306 | Tragic 7.8% |
| Scotch-Irish | 0.0 /100 | #307 | Tragic 7.8% |