Subsaharan African vs Australian Disability Age 18 to 34
COMPARE
Subsaharan African
Australian
Disability Age 18 to 34
Disability Age 18 to 34 Comparison
Sub-Saharan Africans
Australians
7.1%
DISABILITY AGE 18 TO 34
1.7/ 100
METRIC RATING
235th/ 347
METRIC RANK
6.8%
DISABILITY AGE 18 TO 34
19.4/ 100
METRIC RATING
198th/ 347
METRIC RANK
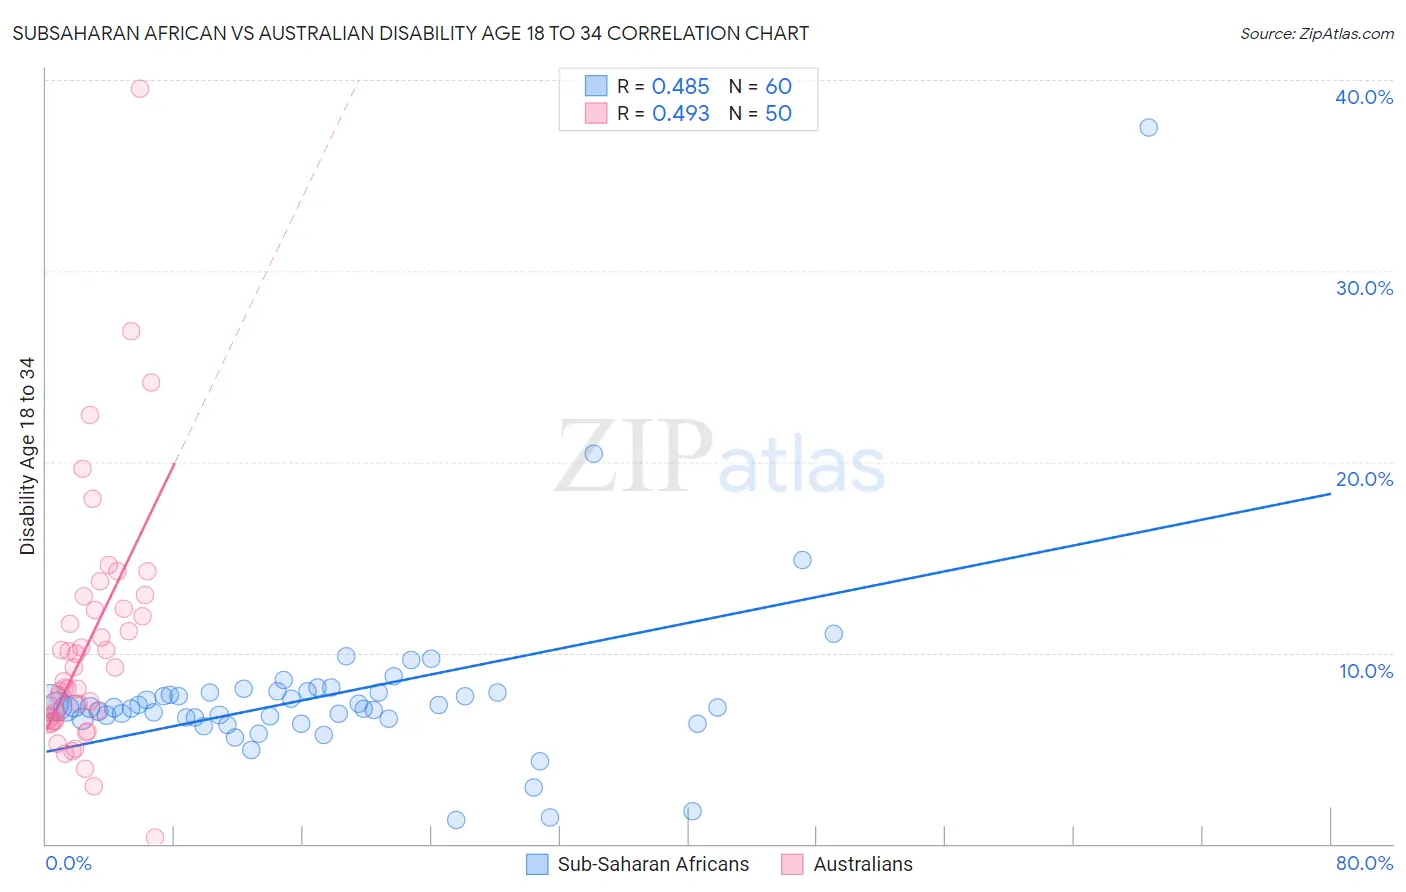
Subsaharan African vs Australian Disability Age 18 to 34 Correlation Chart
The statistical analysis conducted on geographies consisting of 506,334,183 people shows a moderate positive correlation between the proportion of Sub-Saharan Africans and percentage of population with a disability between the ages 18 and 35 in the United States with a correlation coefficient (R) of 0.485 and weighted average of 7.1%. Similarly, the statistical analysis conducted on geographies consisting of 223,842,296 people shows a moderate positive correlation between the proportion of Australians and percentage of population with a disability between the ages 18 and 35 in the United States with a correlation coefficient (R) of 0.493 and weighted average of 6.8%, a difference of 4.5%.
Disability Age 18 to 34 Correlation Summary
| Measurement | Subsaharan African | Australian |
| Minimum | 1.2% | 0.32% |
| Maximum | 37.5% | 39.5% |
| Range | 36.3% | 39.2% |
| Mean | 7.8% | 10.6% |
| Median | 7.1% | 8.9% |
| Interquartile 25% (IQ1) | 6.6% | 6.6% |
| Interquartile 75% (IQ3) | 7.9% | 12.3% |
| Interquartile Range (IQR) | 1.4% | 5.7% |
| Standard Deviation (Sample) | 4.7% | 6.7% |
| Standard Deviation (Population) | 4.7% | 6.6% |
Similar Demographics by Disability Age 18 to 34
Demographics Similar to Sub-Saharan Africans by Disability Age 18 to 34
In terms of disability age 18 to 34, the demographic groups most similar to Sub-Saharan Africans are Liberian (7.1%, a difference of 0.25%), Alsatian (7.0%, a difference of 0.37%), Austrian (7.1%, a difference of 0.42%), Marshallese (7.1%, a difference of 0.47%), and Italian (7.1%, a difference of 0.58%).
| Demographics | Rating | Rank | Disability Age 18 to 34 |
| Immigrants | Yemen | 4.2 /100 | #228 | Tragic 7.0% |
| Lithuanians | 4.1 /100 | #229 | Tragic 7.0% |
| Immigrants | North America | 3.9 /100 | #230 | Tragic 7.0% |
| Ute | 3.8 /100 | #231 | Tragic 7.0% |
| Samoans | 3.2 /100 | #232 | Tragic 7.0% |
| New Zealanders | 2.7 /100 | #233 | Tragic 7.0% |
| Alsatians | 2.1 /100 | #234 | Tragic 7.0% |
| Sub-Saharan Africans | 1.7 /100 | #235 | Tragic 7.1% |
| Liberians | 1.5 /100 | #236 | Tragic 7.1% |
| Austrians | 1.3 /100 | #237 | Tragic 7.1% |
| Marshallese | 1.3 /100 | #238 | Tragic 7.1% |
| Italians | 1.2 /100 | #239 | Tragic 7.1% |
| Arapaho | 1.1 /100 | #240 | Tragic 7.1% |
| Nepalese | 1.1 /100 | #241 | Tragic 7.1% |
| Immigrants | Congo | 1.1 /100 | #242 | Tragic 7.1% |
Demographics Similar to Australians by Disability Age 18 to 34
In terms of disability age 18 to 34, the demographic groups most similar to Australians are Estonian (6.8%, a difference of 0.13%), Kenyan (6.8%, a difference of 0.13%), Immigrants from Netherlands (6.7%, a difference of 0.16%), Sierra Leonean (6.8%, a difference of 0.22%), and Mexican American Indian (6.7%, a difference of 0.29%).
| Demographics | Rating | Rank | Disability Age 18 to 34 |
| Immigrants | Eastern Africa | 33.2 /100 | #191 | Fair 6.7% |
| Immigrants | Western Africa | 28.3 /100 | #192 | Fair 6.7% |
| Immigrants | Uganda | 25.1 /100 | #193 | Fair 6.7% |
| Immigrants | Sudan | 24.9 /100 | #194 | Fair 6.7% |
| Mexican American Indians | 22.3 /100 | #195 | Fair 6.7% |
| Immigrants | Netherlands | 21.0 /100 | #196 | Fair 6.7% |
| Estonians | 20.6 /100 | #197 | Fair 6.8% |
| Australians | 19.4 /100 | #198 | Poor 6.8% |
| Kenyans | 18.3 /100 | #199 | Poor 6.8% |
| Sierra Leoneans | 17.5 /100 | #200 | Poor 6.8% |
| Greeks | 16.1 /100 | #201 | Poor 6.8% |
| Panamanians | 15.8 /100 | #202 | Poor 6.8% |
| Hispanics or Latinos | 13.8 /100 | #203 | Poor 6.8% |
| Immigrants | Bosnia and Herzegovina | 13.6 /100 | #204 | Poor 6.8% |
| Lebanese | 13.3 /100 | #205 | Poor 6.8% |