Subsaharan African vs Immigrants from Thailand Disability Age 18 to 34
COMPARE
Subsaharan African
Immigrants from Thailand
Disability Age 18 to 34
Disability Age 18 to 34 Comparison
Sub-Saharan Africans
Immigrants from Thailand
7.1%
DISABILITY AGE 18 TO 34
1.7/ 100
METRIC RATING
235th/ 347
METRIC RANK
6.9%
DISABILITY AGE 18 TO 34
7.5/ 100
METRIC RATING
215th/ 347
METRIC RANK
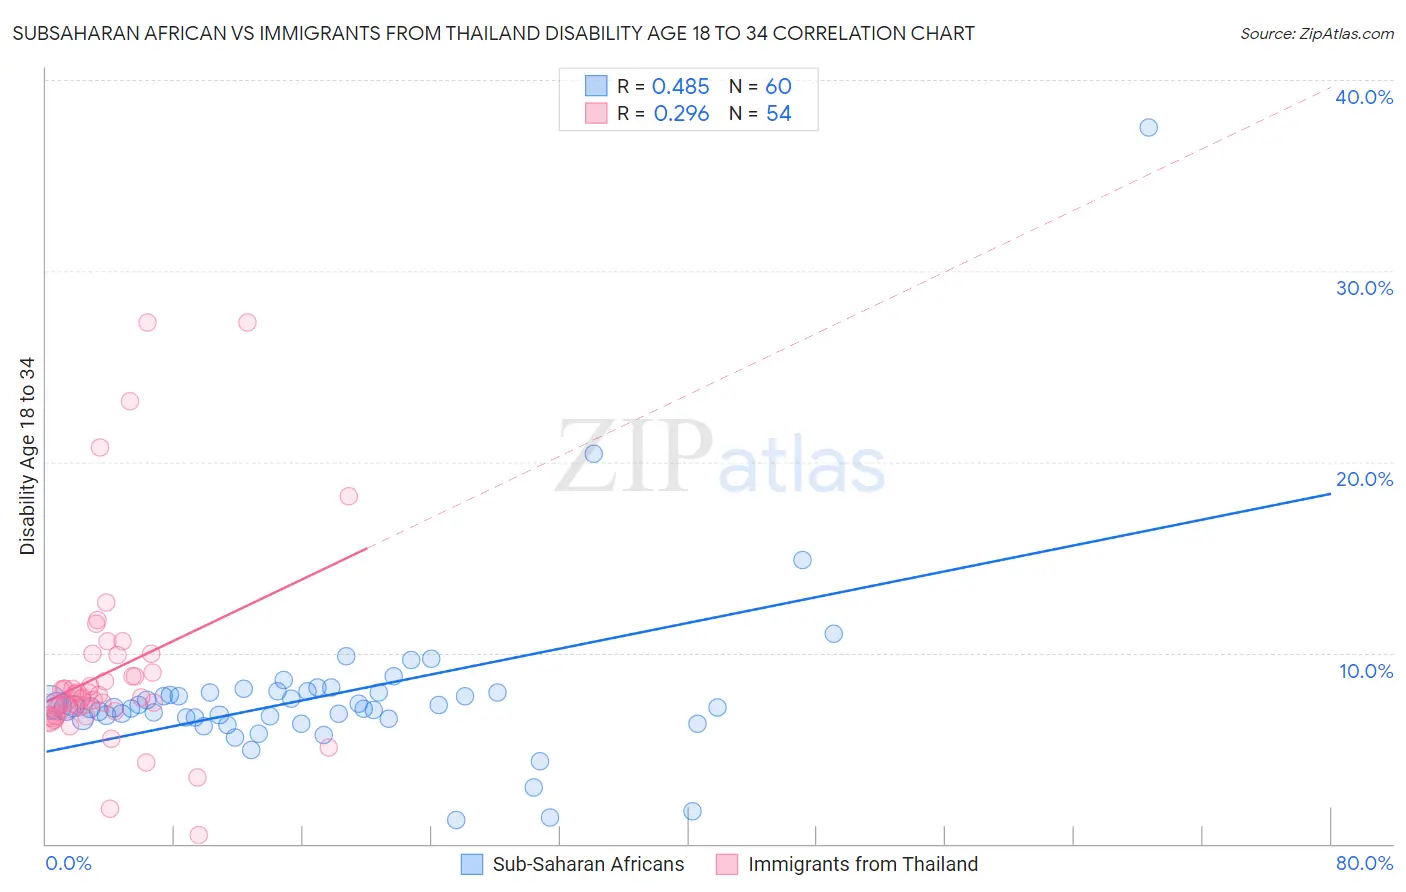
Subsaharan African vs Immigrants from Thailand Disability Age 18 to 34 Correlation Chart
The statistical analysis conducted on geographies consisting of 506,334,183 people shows a moderate positive correlation between the proportion of Sub-Saharan Africans and percentage of population with a disability between the ages 18 and 35 in the United States with a correlation coefficient (R) of 0.485 and weighted average of 7.1%. Similarly, the statistical analysis conducted on geographies consisting of 316,632,491 people shows a weak positive correlation between the proportion of Immigrants from Thailand and percentage of population with a disability between the ages 18 and 35 in the United States with a correlation coefficient (R) of 0.296 and weighted average of 6.9%, a difference of 2.6%.
Disability Age 18 to 34 Correlation Summary
| Measurement | Subsaharan African | Immigrants from Thailand |
| Minimum | 1.2% | 0.44% |
| Maximum | 37.5% | 27.3% |
| Range | 36.3% | 26.8% |
| Mean | 7.8% | 9.0% |
| Median | 7.1% | 7.7% |
| Interquartile 25% (IQ1) | 6.6% | 6.8% |
| Interquartile 75% (IQ3) | 7.9% | 9.0% |
| Interquartile Range (IQR) | 1.4% | 2.2% |
| Standard Deviation (Sample) | 4.7% | 5.2% |
| Standard Deviation (Population) | 4.7% | 5.1% |
Demographics Similar to Sub-Saharan Africans and Immigrants from Thailand by Disability Age 18 to 34
In terms of disability age 18 to 34, the demographic groups most similar to Sub-Saharan Africans are Alsatian (7.0%, a difference of 0.37%), New Zealander (7.0%, a difference of 0.80%), Samoan (7.0%, a difference of 1.1%), Ute (7.0%, a difference of 1.4%), and Immigrants from North America (7.0%, a difference of 1.4%). Similarly, the demographic groups most similar to Immigrants from Thailand are Sudanese (6.9%, a difference of 0.13%), Immigrants from Kenya (6.9%, a difference of 0.15%), Ukrainian (6.9%, a difference of 0.20%), Hawaiian (6.9%, a difference of 0.27%), and Immigrants from Senegal (6.9%, a difference of 0.55%).
| Demographics | Rating | Rank | Disability Age 18 to 34 |
| Immigrants | Thailand | 7.5 /100 | #215 | Tragic 6.9% |
| Sudanese | 7.0 /100 | #216 | Tragic 6.9% |
| Immigrants | Kenya | 6.9 /100 | #217 | Tragic 6.9% |
| Ukrainians | 6.7 /100 | #218 | Tragic 6.9% |
| Hawaiians | 6.5 /100 | #219 | Tragic 6.9% |
| Immigrants | Senegal | 5.5 /100 | #220 | Tragic 6.9% |
| Immigrants | Middle Africa | 5.5 /100 | #221 | Tragic 6.9% |
| Immigrants | England | 5.3 /100 | #222 | Tragic 6.9% |
| Carpatho Rusyns | 5.2 /100 | #223 | Tragic 6.9% |
| Senegalese | 4.9 /100 | #224 | Tragic 6.9% |
| Central American Indians | 4.7 /100 | #225 | Tragic 6.9% |
| Ugandans | 4.4 /100 | #226 | Tragic 6.9% |
| Immigrants | Canada | 4.3 /100 | #227 | Tragic 7.0% |
| Immigrants | Yemen | 4.2 /100 | #228 | Tragic 7.0% |
| Lithuanians | 4.1 /100 | #229 | Tragic 7.0% |
| Immigrants | North America | 3.9 /100 | #230 | Tragic 7.0% |
| Ute | 3.8 /100 | #231 | Tragic 7.0% |
| Samoans | 3.2 /100 | #232 | Tragic 7.0% |
| New Zealanders | 2.7 /100 | #233 | Tragic 7.0% |
| Alsatians | 2.1 /100 | #234 | Tragic 7.0% |
| Sub-Saharan Africans | 1.7 /100 | #235 | Tragic 7.1% |