Subsaharan African vs Seminole Disability Age 18 to 34
COMPARE
Subsaharan African
Seminole
Disability Age 18 to 34
Disability Age 18 to 34 Comparison
Sub-Saharan Africans
Seminole
7.1%
DISABILITY AGE 18 TO 34
1.7/ 100
METRIC RATING
235th/ 347
METRIC RANK
8.4%
DISABILITY AGE 18 TO 34
0.0/ 100
METRIC RATING
335th/ 347
METRIC RANK
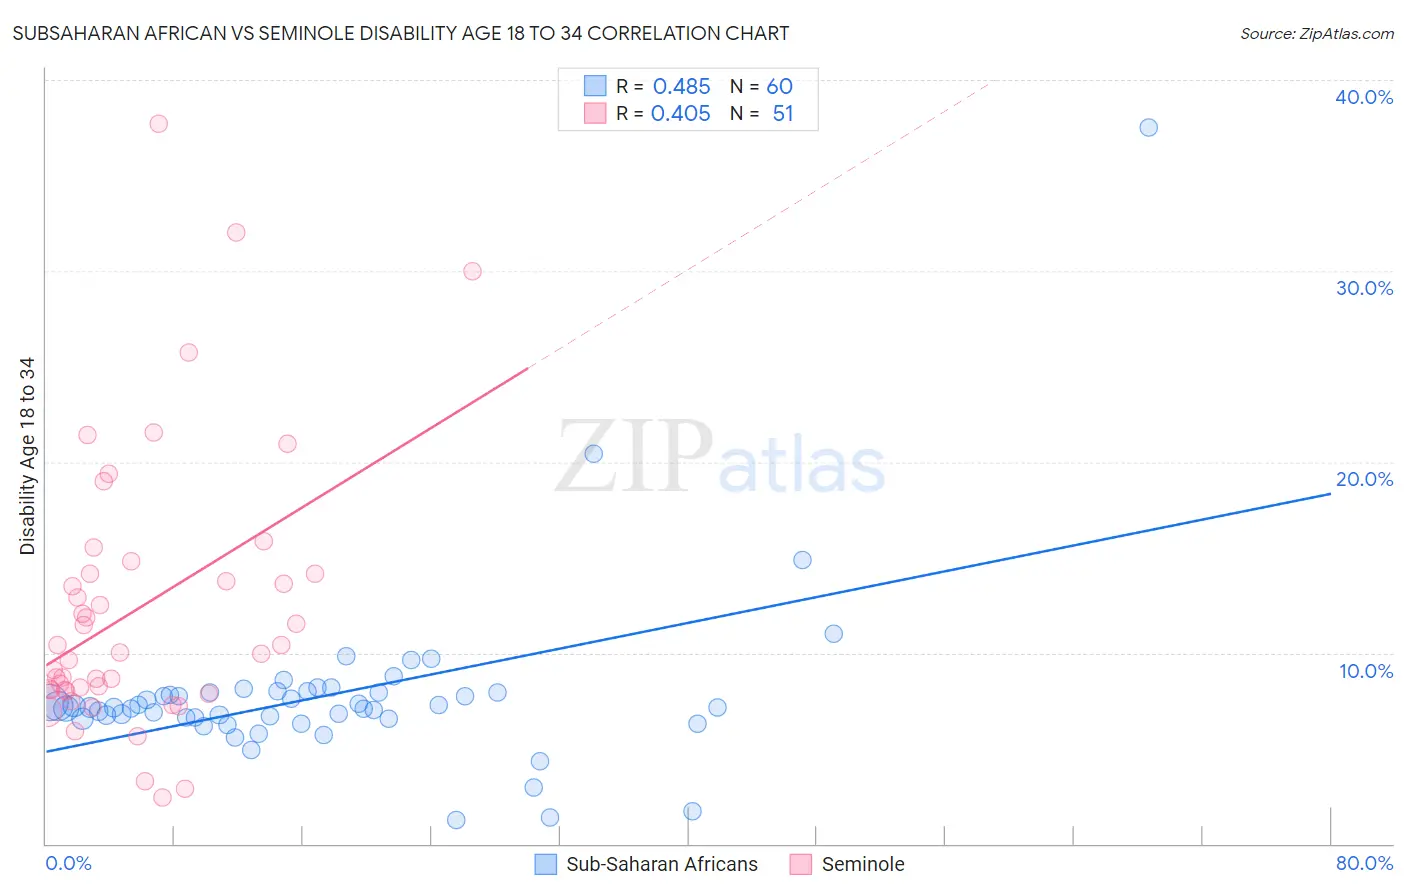
Subsaharan African vs Seminole Disability Age 18 to 34 Correlation Chart
The statistical analysis conducted on geographies consisting of 506,334,183 people shows a moderate positive correlation between the proportion of Sub-Saharan Africans and percentage of population with a disability between the ages 18 and 35 in the United States with a correlation coefficient (R) of 0.485 and weighted average of 7.1%. Similarly, the statistical analysis conducted on geographies consisting of 118,263,195 people shows a moderate positive correlation between the proportion of Seminole and percentage of population with a disability between the ages 18 and 35 in the United States with a correlation coefficient (R) of 0.405 and weighted average of 8.4%, a difference of 19.5%.
Disability Age 18 to 34 Correlation Summary
| Measurement | Subsaharan African | Seminole |
| Minimum | 1.2% | 2.4% |
| Maximum | 37.5% | 37.7% |
| Range | 36.3% | 35.3% |
| Mean | 7.8% | 12.4% |
| Median | 7.1% | 10.0% |
| Interquartile 25% (IQ1) | 6.6% | 8.1% |
| Interquartile 75% (IQ3) | 7.9% | 14.2% |
| Interquartile Range (IQR) | 1.4% | 6.1% |
| Standard Deviation (Sample) | 4.7% | 7.2% |
| Standard Deviation (Population) | 4.7% | 7.2% |
Similar Demographics by Disability Age 18 to 34
Demographics Similar to Sub-Saharan Africans by Disability Age 18 to 34
In terms of disability age 18 to 34, the demographic groups most similar to Sub-Saharan Africans are Liberian (7.1%, a difference of 0.25%), Alsatian (7.0%, a difference of 0.37%), Austrian (7.1%, a difference of 0.42%), Marshallese (7.1%, a difference of 0.47%), and Italian (7.1%, a difference of 0.58%).
| Demographics | Rating | Rank | Disability Age 18 to 34 |
| Immigrants | Yemen | 4.2 /100 | #228 | Tragic 7.0% |
| Lithuanians | 4.1 /100 | #229 | Tragic 7.0% |
| Immigrants | North America | 3.9 /100 | #230 | Tragic 7.0% |
| Ute | 3.8 /100 | #231 | Tragic 7.0% |
| Samoans | 3.2 /100 | #232 | Tragic 7.0% |
| New Zealanders | 2.7 /100 | #233 | Tragic 7.0% |
| Alsatians | 2.1 /100 | #234 | Tragic 7.0% |
| Sub-Saharan Africans | 1.7 /100 | #235 | Tragic 7.1% |
| Liberians | 1.5 /100 | #236 | Tragic 7.1% |
| Austrians | 1.3 /100 | #237 | Tragic 7.1% |
| Marshallese | 1.3 /100 | #238 | Tragic 7.1% |
| Italians | 1.2 /100 | #239 | Tragic 7.1% |
| Arapaho | 1.1 /100 | #240 | Tragic 7.1% |
| Nepalese | 1.1 /100 | #241 | Tragic 7.1% |
| Immigrants | Congo | 1.1 /100 | #242 | Tragic 7.1% |
Demographics Similar to Seminole by Disability Age 18 to 34
In terms of disability age 18 to 34, the demographic groups most similar to Seminole are Dutch West Indian (8.4%, a difference of 0.11%), Apache (8.4%, a difference of 0.33%), Immigrants from the Azores (8.5%, a difference of 1.2%), Puget Sound Salish (8.3%, a difference of 1.4%), and Comanche (8.3%, a difference of 1.6%).
| Demographics | Rating | Rank | Disability Age 18 to 34 |
| Delaware | 0.0 /100 | #328 | Tragic 8.2% |
| Crow | 0.0 /100 | #329 | Tragic 8.3% |
| Osage | 0.0 /100 | #330 | Tragic 8.3% |
| Comanche | 0.0 /100 | #331 | Tragic 8.3% |
| Puget Sound Salish | 0.0 /100 | #332 | Tragic 8.3% |
| Apache | 0.0 /100 | #333 | Tragic 8.4% |
| Dutch West Indians | 0.0 /100 | #334 | Tragic 8.4% |
| Seminole | 0.0 /100 | #335 | Tragic 8.4% |
| Immigrants | Azores | 0.0 /100 | #336 | Tragic 8.5% |
| Ottawa | 0.0 /100 | #337 | Tragic 8.6% |
| Cherokee | 0.0 /100 | #338 | Tragic 8.7% |
| Kiowa | 0.0 /100 | #339 | Tragic 8.8% |
| Choctaw | 0.0 /100 | #340 | Tragic 9.0% |
| Chickasaw | 0.0 /100 | #341 | Tragic 9.0% |
| Yakama | 0.0 /100 | #342 | Tragic 9.0% |