Subsaharan African vs Cree Disability Age 35 to 64
COMPARE
Subsaharan African
Cree
Disability Age 35 to 64
Disability Age 35 to 64 Comparison
Sub-Saharan Africans
Cree
12.6%
DISABILITY AGE 35 TO 64
0.2/ 100
METRIC RATING
267th/ 347
METRIC RANK
14.1%
DISABILITY AGE 35 TO 64
0.0/ 100
METRIC RATING
309th/ 347
METRIC RANK
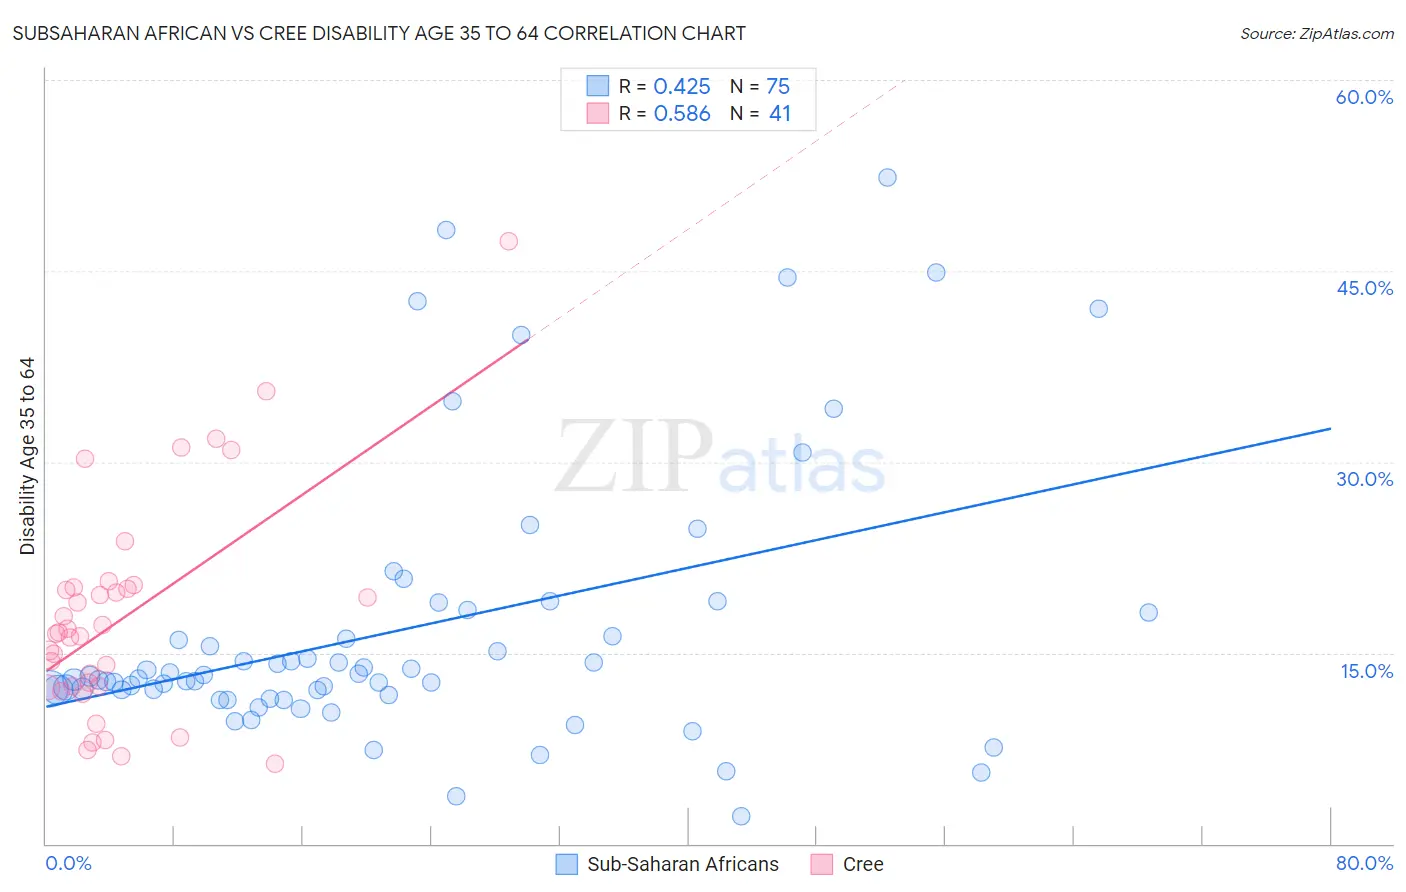
Subsaharan African vs Cree Disability Age 35 to 64 Correlation Chart
The statistical analysis conducted on geographies consisting of 507,479,662 people shows a moderate positive correlation between the proportion of Sub-Saharan Africans and percentage of population with a disability between the ages 34 and 64 in the United States with a correlation coefficient (R) of 0.425 and weighted average of 12.6%. Similarly, the statistical analysis conducted on geographies consisting of 76,205,381 people shows a substantial positive correlation between the proportion of Cree and percentage of population with a disability between the ages 34 and 64 in the United States with a correlation coefficient (R) of 0.586 and weighted average of 14.1%, a difference of 11.3%.
Disability Age 35 to 64 Correlation Summary
| Measurement | Subsaharan African | Cree |
| Minimum | 2.2% | 6.3% |
| Maximum | 52.4% | 47.4% |
| Range | 50.2% | 41.1% |
| Mean | 16.8% | 17.7% |
| Median | 12.9% | 16.5% |
| Interquartile 25% (IQ1) | 11.6% | 12.3% |
| Interquartile 75% (IQ3) | 18.2% | 20.1% |
| Interquartile Range (IQR) | 6.5% | 7.8% |
| Standard Deviation (Sample) | 10.7% | 8.6% |
| Standard Deviation (Population) | 10.7% | 8.5% |
Similar Demographics by Disability Age 35 to 64
Demographics Similar to Sub-Saharan Africans by Disability Age 35 to 64
In terms of disability age 35 to 64, the demographic groups most similar to Sub-Saharan Africans are White/Caucasian (12.6%, a difference of 0.16%), Immigrants from Dominica (12.7%, a difference of 0.18%), Spanish (12.7%, a difference of 0.28%), French (12.7%, a difference of 0.33%), and Marshallese (12.5%, a difference of 0.86%).
| Demographics | Rating | Rank | Disability Age 35 to 64 |
| German Russians | 0.5 /100 | #260 | Tragic 12.5% |
| Malaysians | 0.5 /100 | #261 | Tragic 12.5% |
| Senegalese | 0.5 /100 | #262 | Tragic 12.5% |
| Immigrants | Zaire | 0.4 /100 | #263 | Tragic 12.5% |
| Immigrants | Portugal | 0.4 /100 | #264 | Tragic 12.5% |
| Marshallese | 0.4 /100 | #265 | Tragic 12.5% |
| Whites/Caucasians | 0.3 /100 | #266 | Tragic 12.6% |
| Sub-Saharan Africans | 0.2 /100 | #267 | Tragic 12.6% |
| Immigrants | Dominica | 0.2 /100 | #268 | Tragic 12.7% |
| Spanish | 0.2 /100 | #269 | Tragic 12.7% |
| French | 0.2 /100 | #270 | Tragic 12.7% |
| Nepalese | 0.1 /100 | #271 | Tragic 12.8% |
| U.S. Virgin Islanders | 0.1 /100 | #272 | Tragic 12.8% |
| Pennsylvania Germans | 0.1 /100 | #273 | Tragic 12.8% |
| Celtics | 0.1 /100 | #274 | Tragic 12.9% |
Demographics Similar to Cree by Disability Age 35 to 64
In terms of disability age 35 to 64, the demographic groups most similar to Cree are Inupiat (14.1%, a difference of 0.070%), Blackfeet (14.1%, a difference of 0.10%), Immigrants from Yemen (14.0%, a difference of 0.26%), Cape Verdean (14.1%, a difference of 0.47%), and American (13.9%, a difference of 1.1%).
| Demographics | Rating | Rank | Disability Age 35 to 64 |
| Aleuts | 0.0 /100 | #302 | Tragic 13.8% |
| Sioux | 0.0 /100 | #303 | Tragic 13.9% |
| Hopi | 0.0 /100 | #304 | Tragic 13.9% |
| Americans | 0.0 /100 | #305 | Tragic 13.9% |
| Immigrants | Yemen | 0.0 /100 | #306 | Tragic 14.0% |
| Blackfeet | 0.0 /100 | #307 | Tragic 14.1% |
| Inupiat | 0.0 /100 | #308 | Tragic 14.1% |
| Cree | 0.0 /100 | #309 | Tragic 14.1% |
| Cape Verdeans | 0.0 /100 | #310 | Tragic 14.1% |
| Immigrants | Azores | 0.0 /100 | #311 | Tragic 14.3% |
| Paiute | 0.0 /100 | #312 | Tragic 14.3% |
| Iroquois | 0.0 /100 | #313 | Tragic 14.4% |
| Shoshone | 0.0 /100 | #314 | Tragic 14.5% |
| Alaska Natives | 0.0 /100 | #315 | Tragic 14.5% |
| Osage | 0.0 /100 | #316 | Tragic 14.5% |