Pakistani vs Cree Disability Age 18 to 34
COMPARE
Pakistani
Cree
Disability Age 18 to 34
Disability Age 18 to 34 Comparison
Pakistanis
Cree
6.7%
DISABILITY AGE 18 TO 34
33.7/ 100
METRIC RATING
189th/ 347
METRIC RANK
8.1%
DISABILITY AGE 18 TO 34
0.0/ 100
METRIC RATING
322nd/ 347
METRIC RANK
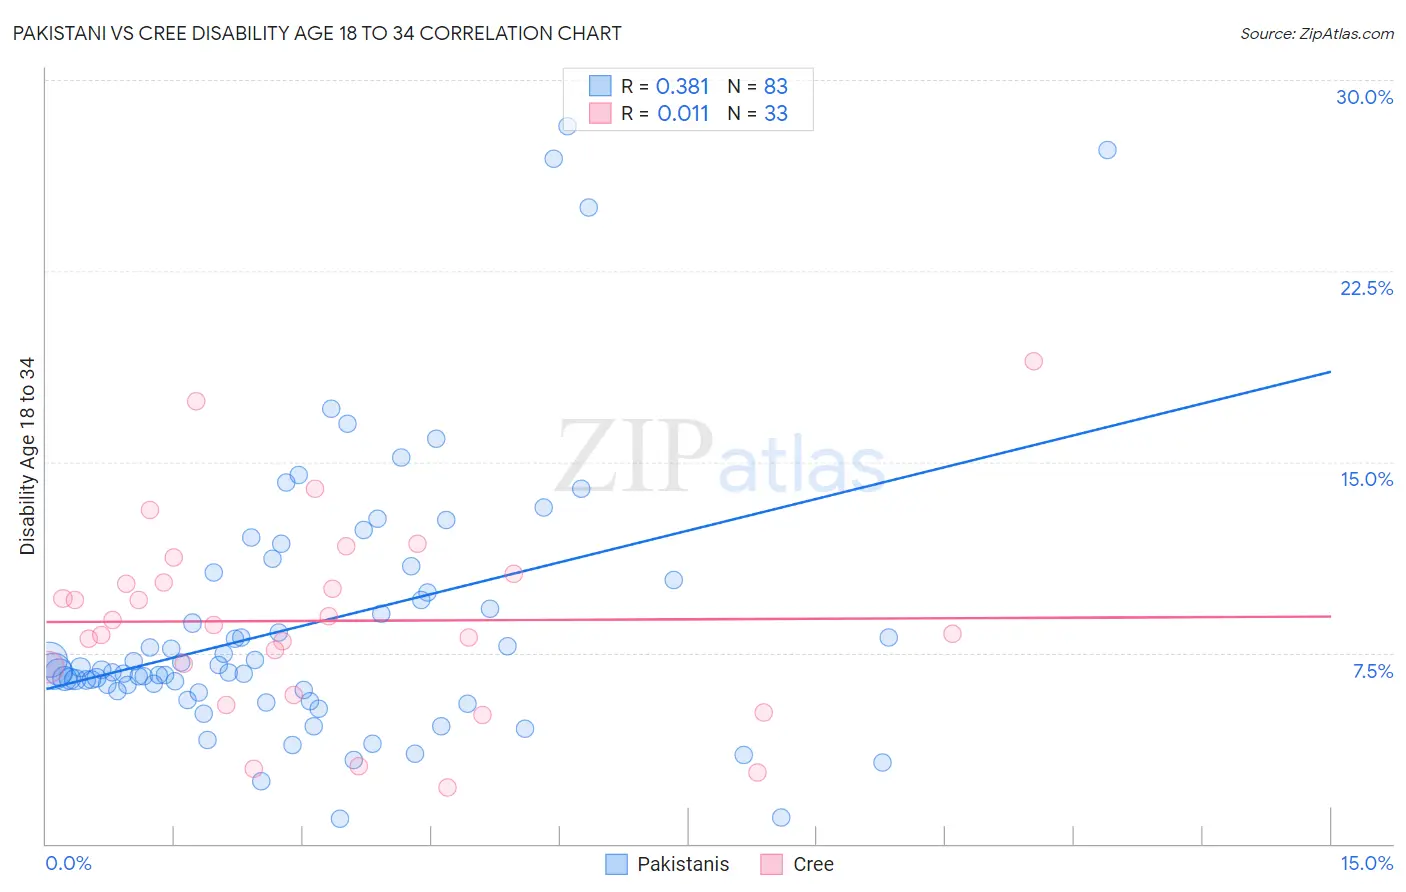
Pakistani vs Cree Disability Age 18 to 34 Correlation Chart
The statistical analysis conducted on geographies consisting of 334,881,501 people shows a mild positive correlation between the proportion of Pakistanis and percentage of population with a disability between the ages 18 and 35 in the United States with a correlation coefficient (R) of 0.381 and weighted average of 6.7%. Similarly, the statistical analysis conducted on geographies consisting of 76,144,663 people shows no correlation between the proportion of Cree and percentage of population with a disability between the ages 18 and 35 in the United States with a correlation coefficient (R) of 0.011 and weighted average of 8.1%, a difference of 21.7%.
Disability Age 18 to 34 Correlation Summary
| Measurement | Pakistani | Cree |
| Minimum | 0.96% | 2.2% |
| Maximum | 28.2% | 19.0% |
| Range | 27.2% | 16.8% |
| Mean | 8.6% | 8.8% |
| Median | 6.8% | 8.6% |
| Interquartile 25% (IQ1) | 6.0% | 6.4% |
| Interquartile 75% (IQ3) | 10.4% | 10.4% |
| Interquartile Range (IQR) | 4.4% | 4.0% |
| Standard Deviation (Sample) | 5.3% | 3.8% |
| Standard Deviation (Population) | 5.3% | 3.7% |
Similar Demographics by Disability Age 18 to 34
Demographics Similar to Pakistanis by Disability Age 18 to 34
In terms of disability age 18 to 34, the demographic groups most similar to Pakistanis are Immigrants from Zimbabwe (6.7%, a difference of 0.010%), Immigrants from Eastern Africa (6.7%, a difference of 0.040%), Immigrants from Cameroon (6.7%, a difference of 0.060%), Maltese (6.7%, a difference of 0.090%), and Yup'ik (6.7%, a difference of 0.12%).
| Demographics | Rating | Rank | Disability Age 18 to 34 |
| U.S. Virgin Islanders | 38.6 /100 | #182 | Fair 6.7% |
| Immigrants | Iraq | 37.4 /100 | #183 | Fair 6.7% |
| Iraqis | 37.4 /100 | #184 | Fair 6.7% |
| Immigrants | Oceania | 35.4 /100 | #185 | Fair 6.7% |
| Yup'ik | 35.3 /100 | #186 | Fair 6.7% |
| Maltese | 34.8 /100 | #187 | Fair 6.7% |
| Immigrants | Cameroon | 34.5 /100 | #188 | Fair 6.7% |
| Pakistanis | 33.7 /100 | #189 | Fair 6.7% |
| Immigrants | Zimbabwe | 33.6 /100 | #190 | Fair 6.7% |
| Immigrants | Eastern Africa | 33.2 /100 | #191 | Fair 6.7% |
| Immigrants | Western Africa | 28.3 /100 | #192 | Fair 6.7% |
| Immigrants | Uganda | 25.1 /100 | #193 | Fair 6.7% |
| Immigrants | Sudan | 24.9 /100 | #194 | Fair 6.7% |
| Mexican American Indians | 22.3 /100 | #195 | Fair 6.7% |
| Immigrants | Netherlands | 21.0 /100 | #196 | Fair 6.7% |
Demographics Similar to Cree by Disability Age 18 to 34
In terms of disability age 18 to 34, the demographic groups most similar to Cree are Blackfeet (8.1%, a difference of 0.060%), Navajo (8.1%, a difference of 0.42%), Aleut (8.1%, a difference of 0.46%), French Canadian (8.1%, a difference of 0.51%), and French American Indian (8.2%, a difference of 0.51%).
| Demographics | Rating | Rank | Disability Age 18 to 34 |
| Americans | 0.0 /100 | #315 | Tragic 8.0% |
| Puerto Ricans | 0.0 /100 | #316 | Tragic 8.0% |
| Hmong | 0.0 /100 | #317 | Tragic 8.1% |
| French Canadians | 0.0 /100 | #318 | Tragic 8.1% |
| Aleuts | 0.0 /100 | #319 | Tragic 8.1% |
| Navajo | 0.0 /100 | #320 | Tragic 8.1% |
| Blackfeet | 0.0 /100 | #321 | Tragic 8.1% |
| Cree | 0.0 /100 | #322 | Tragic 8.1% |
| French American Indians | 0.0 /100 | #323 | Tragic 8.2% |
| Cajuns | 0.0 /100 | #324 | Tragic 8.2% |
| Natives/Alaskans | 0.0 /100 | #325 | Tragic 8.2% |
| Potawatomi | 0.0 /100 | #326 | Tragic 8.2% |
| Sioux | 0.0 /100 | #327 | Tragic 8.2% |
| Delaware | 0.0 /100 | #328 | Tragic 8.2% |
| Crow | 0.0 /100 | #329 | Tragic 8.3% |