Subsaharan African vs Cree Unemployment Among Seniors over 65 years
COMPARE
Subsaharan African
Cree
Unemployment Among Seniors over 65 years
Unemployment Among Seniors over 65 years Comparison
Sub-Saharan Africans
Cree
5.2%
UNEMPLOYMENT AMONG SENIORS OVER 65 YEARS
17.1/ 100
METRIC RATING
203rd/ 347
METRIC RANK
5.3%
UNEMPLOYMENT AMONG SENIORS OVER 65 YEARS
5.8/ 100
METRIC RATING
223rd/ 347
METRIC RANK
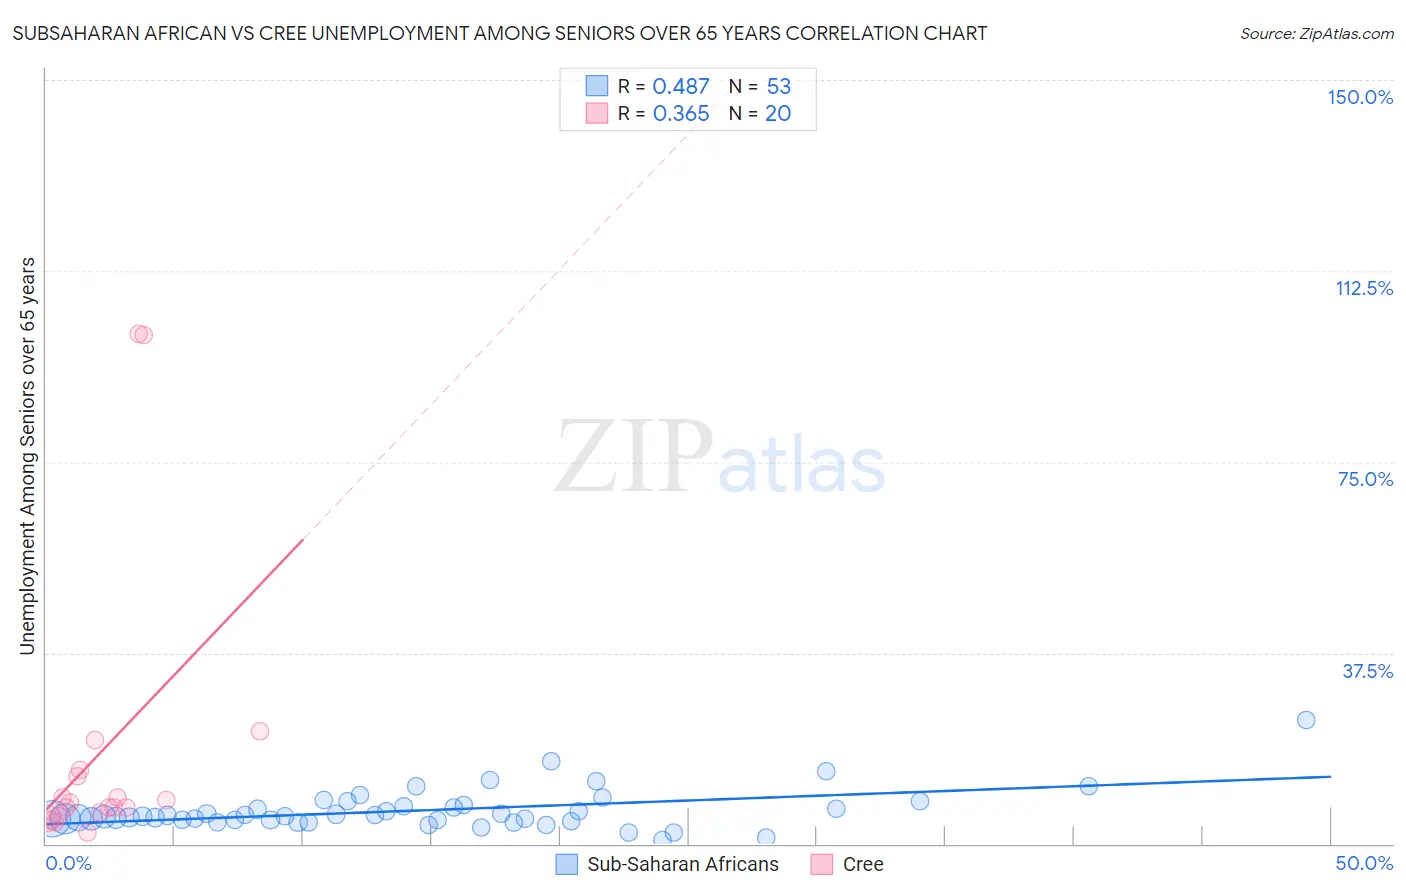
Subsaharan African vs Cree Unemployment Among Seniors over 65 years Correlation Chart
The statistical analysis conducted on geographies consisting of 436,089,734 people shows a moderate positive correlation between the proportion of Sub-Saharan Africans and unemployment rate amomg seniors over the age of 65 in the United States with a correlation coefficient (R) of 0.487 and weighted average of 5.2%. Similarly, the statistical analysis conducted on geographies consisting of 73,743,775 people shows a mild positive correlation between the proportion of Cree and unemployment rate amomg seniors over the age of 65 in the United States with a correlation coefficient (R) of 0.365 and weighted average of 5.3%, a difference of 0.96%.
Unemployment Among Seniors over 65 years Correlation Summary
| Measurement | Subsaharan African | Cree |
| Minimum | 0.70% | 2.3% |
| Maximum | 24.3% | 100.1% |
| Range | 23.6% | 97.8% |
| Mean | 6.5% | 18.1% |
| Median | 5.3% | 7.7% |
| Interquartile 25% (IQ1) | 4.7% | 5.8% |
| Interquartile 75% (IQ3) | 7.4% | 13.8% |
| Interquartile Range (IQR) | 2.7% | 8.0% |
| Standard Deviation (Sample) | 4.0% | 28.5% |
| Standard Deviation (Population) | 3.9% | 27.8% |
Demographics Similar to Sub-Saharan Africans and Cree by Unemployment Among Seniors over 65 years
In terms of unemployment among seniors over 65 years, the demographic groups most similar to Sub-Saharan Africans are Immigrants from China (5.2%, a difference of 0.010%), South American Indian (5.2%, a difference of 0.11%), German Russian (5.2%, a difference of 0.14%), Immigrants from Philippines (5.2%, a difference of 0.24%), and Uruguayan (5.2%, a difference of 0.28%). Similarly, the demographic groups most similar to Cree are Israeli (5.3%, a difference of 0.060%), Arapaho (5.3%, a difference of 0.080%), Egyptian (5.3%, a difference of 0.090%), Dutch West Indian (5.3%, a difference of 0.15%), and Spaniard (5.2%, a difference of 0.21%).
| Demographics | Rating | Rank | Unemployment Among Seniors over 65 years |
| Sub-Saharan Africans | 17.1 /100 | #203 | Poor 5.2% |
| Immigrants | China | 16.9 /100 | #204 | Poor 5.2% |
| South American Indians | 15.3 /100 | #205 | Poor 5.2% |
| German Russians | 14.7 /100 | #206 | Poor 5.2% |
| Immigrants | Philippines | 13.2 /100 | #207 | Poor 5.2% |
| Uruguayans | 12.6 /100 | #208 | Poor 5.2% |
| Alsatians | 11.4 /100 | #209 | Poor 5.2% |
| Immigrants | Uzbekistan | 10.7 /100 | #210 | Poor 5.2% |
| Africans | 10.4 /100 | #211 | Poor 5.2% |
| Immigrants | Honduras | 10.2 /100 | #212 | Poor 5.2% |
| Immigrants | Uruguay | 9.3 /100 | #213 | Tragic 5.2% |
| Albanians | 9.1 /100 | #214 | Tragic 5.2% |
| Immigrants | Fiji | 8.6 /100 | #215 | Tragic 5.2% |
| Cajuns | 8.5 /100 | #216 | Tragic 5.2% |
| Italians | 8.3 /100 | #217 | Tragic 5.2% |
| Spaniards | 7.4 /100 | #218 | Tragic 5.2% |
| Dutch West Indians | 6.9 /100 | #219 | Tragic 5.3% |
| Egyptians | 6.4 /100 | #220 | Tragic 5.3% |
| Arapaho | 6.3 /100 | #221 | Tragic 5.3% |
| Israelis | 6.2 /100 | #222 | Tragic 5.3% |
| Cree | 5.8 /100 | #223 | Tragic 5.3% |