Welsh vs Cree Disability Age 18 to 34
COMPARE
Welsh
Cree
Disability Age 18 to 34
Disability Age 18 to 34 Comparison
Welsh
Cree
7.7%
DISABILITY AGE 18 TO 34
0.0/ 100
METRIC RATING
302nd/ 347
METRIC RANK
8.1%
DISABILITY AGE 18 TO 34
0.0/ 100
METRIC RATING
322nd/ 347
METRIC RANK
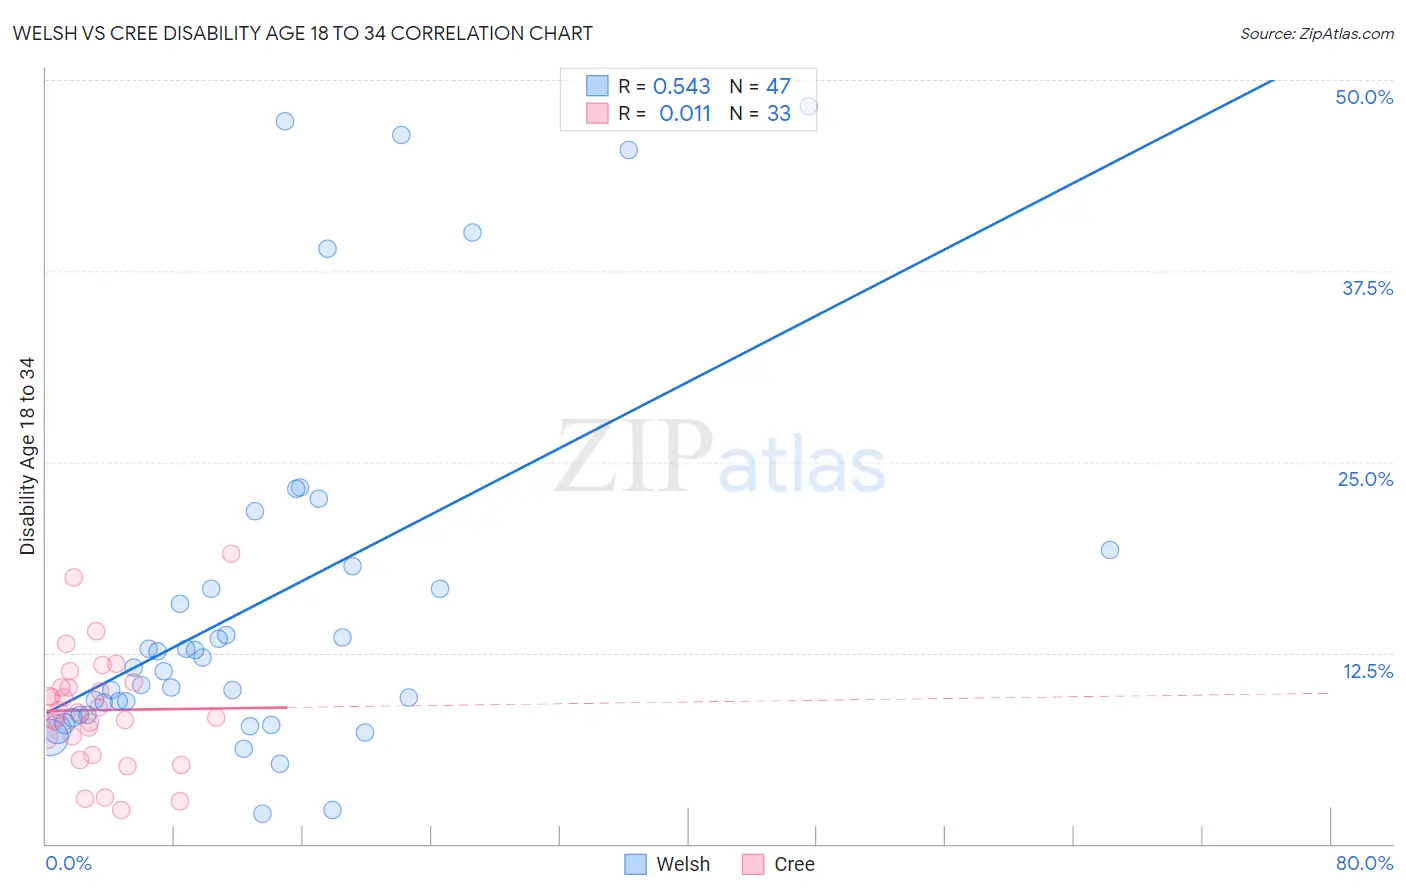
Welsh vs Cree Disability Age 18 to 34 Correlation Chart
The statistical analysis conducted on geographies consisting of 524,899,929 people shows a substantial positive correlation between the proportion of Welsh and percentage of population with a disability between the ages 18 and 35 in the United States with a correlation coefficient (R) of 0.543 and weighted average of 7.7%. Similarly, the statistical analysis conducted on geographies consisting of 76,144,663 people shows no correlation between the proportion of Cree and percentage of population with a disability between the ages 18 and 35 in the United States with a correlation coefficient (R) of 0.011 and weighted average of 8.1%, a difference of 5.0%.
Disability Age 18 to 34 Correlation Summary
| Measurement | Welsh | Cree |
| Minimum | 1.9% | 2.2% |
| Maximum | 48.3% | 19.0% |
| Range | 46.3% | 16.8% |
| Mean | 15.8% | 8.8% |
| Median | 11.6% | 8.6% |
| Interquartile 25% (IQ1) | 8.5% | 6.4% |
| Interquartile 75% (IQ3) | 18.2% | 10.4% |
| Interquartile Range (IQR) | 9.7% | 4.0% |
| Standard Deviation (Sample) | 12.2% | 3.8% |
| Standard Deviation (Population) | 12.0% | 3.7% |
Demographics Similar to Welsh and Cree by Disability Age 18 to 34
In terms of disability age 18 to 34, the demographic groups most similar to Welsh are Cheyenne (7.7%, a difference of 0.060%), Shoshone (7.8%, a difference of 0.41%), Menominee (7.8%, a difference of 0.49%), English (7.8%, a difference of 0.57%), and Scotch-Irish (7.8%, a difference of 0.83%). Similarly, the demographic groups most similar to Cree are Blackfeet (8.1%, a difference of 0.060%), Navajo (8.1%, a difference of 0.42%), Aleut (8.1%, a difference of 0.46%), French Canadian (8.1%, a difference of 0.51%), and Hmong (8.1%, a difference of 0.93%).
| Demographics | Rating | Rank | Disability Age 18 to 34 |
| Welsh | 0.0 /100 | #302 | Tragic 7.7% |
| Cheyenne | 0.0 /100 | #303 | Tragic 7.7% |
| Shoshone | 0.0 /100 | #304 | Tragic 7.8% |
| Menominee | 0.0 /100 | #305 | Tragic 7.8% |
| English | 0.0 /100 | #306 | Tragic 7.8% |
| Scotch-Irish | 0.0 /100 | #307 | Tragic 7.8% |
| Pennsylvania Germans | 0.0 /100 | #308 | Tragic 7.8% |
| Alaska Natives | 0.0 /100 | #309 | Tragic 7.8% |
| Finns | 0.0 /100 | #310 | Tragic 7.8% |
| French | 0.0 /100 | #311 | Tragic 7.9% |
| Spanish Americans | 0.0 /100 | #312 | Tragic 7.9% |
| Iroquois | 0.0 /100 | #313 | Tragic 7.9% |
| Colville | 0.0 /100 | #314 | Tragic 7.9% |
| Americans | 0.0 /100 | #315 | Tragic 8.0% |
| Puerto Ricans | 0.0 /100 | #316 | Tragic 8.0% |
| Hmong | 0.0 /100 | #317 | Tragic 8.1% |
| French Canadians | 0.0 /100 | #318 | Tragic 8.1% |
| Aleuts | 0.0 /100 | #319 | Tragic 8.1% |
| Navajo | 0.0 /100 | #320 | Tragic 8.1% |
| Blackfeet | 0.0 /100 | #321 | Tragic 8.1% |
| Cree | 0.0 /100 | #322 | Tragic 8.1% |