Black/African American vs Australian Disability Age 18 to 34
COMPARE
Black/African American
Australian
Disability Age 18 to 34
Disability Age 18 to 34 Comparison
Blacks/African Americans
Australians
7.7%
DISABILITY AGE 18 TO 34
0.0/ 100
METRIC RATING
292nd/ 347
METRIC RANK
6.8%
DISABILITY AGE 18 TO 34
19.4/ 100
METRIC RATING
198th/ 347
METRIC RANK
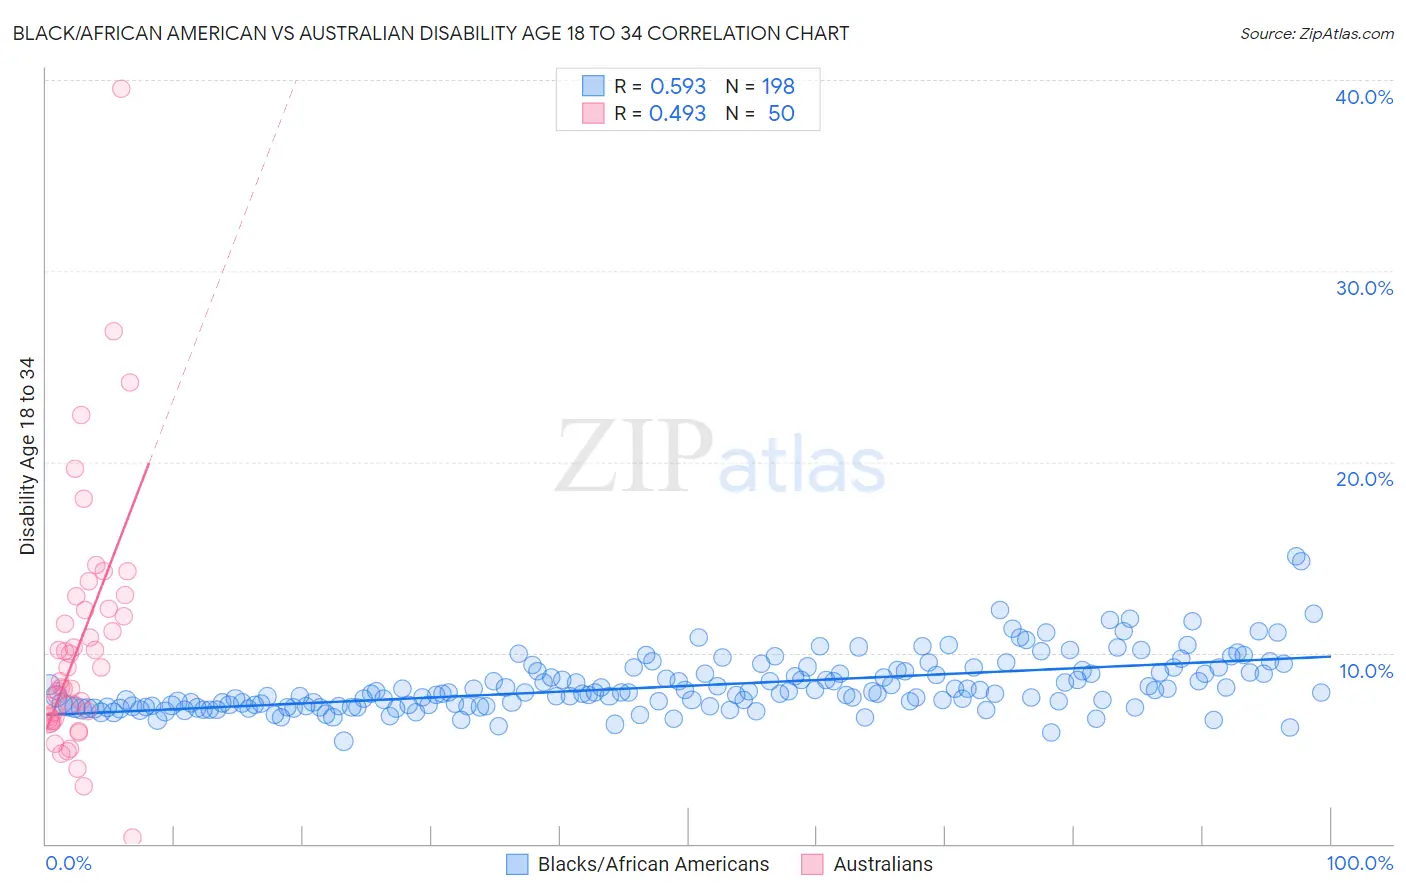
Black/African American vs Australian Disability Age 18 to 34 Correlation Chart
The statistical analysis conducted on geographies consisting of 561,495,678 people shows a substantial positive correlation between the proportion of Blacks/African Americans and percentage of population with a disability between the ages 18 and 35 in the United States with a correlation coefficient (R) of 0.593 and weighted average of 7.7%. Similarly, the statistical analysis conducted on geographies consisting of 223,842,296 people shows a moderate positive correlation between the proportion of Australians and percentage of population with a disability between the ages 18 and 35 in the United States with a correlation coefficient (R) of 0.493 and weighted average of 6.8%, a difference of 13.5%.
Disability Age 18 to 34 Correlation Summary
| Measurement | Black/African American | Australian |
| Minimum | 5.3% | 0.32% |
| Maximum | 15.1% | 39.5% |
| Range | 9.7% | 39.2% |
| Mean | 8.3% | 10.6% |
| Median | 7.9% | 8.9% |
| Interquartile 25% (IQ1) | 7.2% | 6.6% |
| Interquartile 75% (IQ3) | 9.0% | 12.3% |
| Interquartile Range (IQR) | 1.8% | 5.7% |
| Standard Deviation (Sample) | 1.5% | 6.7% |
| Standard Deviation (Population) | 1.5% | 6.6% |
Similar Demographics by Disability Age 18 to 34
Demographics Similar to Blacks/African Americans by Disability Age 18 to 34
In terms of disability age 18 to 34, the demographic groups most similar to Blacks/African Americans are Scandinavian (7.7%, a difference of 0.060%), Immigrants from Cabo Verde (7.7%, a difference of 0.21%), Irish (7.7%, a difference of 0.22%), Tlingit-Haida (7.7%, a difference of 0.22%), and Slovak (7.7%, a difference of 0.27%).
| Demographics | Rating | Rank | Disability Age 18 to 34 |
| Swedes | 0.0 /100 | #285 | Tragic 7.5% |
| Celtics | 0.0 /100 | #286 | Tragic 7.6% |
| Norwegians | 0.0 /100 | #287 | Tragic 7.6% |
| Whites/Caucasians | 0.0 /100 | #288 | Tragic 7.6% |
| Immigrants | Nonimmigrants | 0.0 /100 | #289 | Tragic 7.6% |
| Slovaks | 0.0 /100 | #290 | Tragic 7.7% |
| Irish | 0.0 /100 | #291 | Tragic 7.7% |
| Blacks/African Americans | 0.0 /100 | #292 | Tragic 7.7% |
| Scandinavians | 0.0 /100 | #293 | Tragic 7.7% |
| Immigrants | Cabo Verde | 0.0 /100 | #294 | Tragic 7.7% |
| Tlingit-Haida | 0.0 /100 | #295 | Tragic 7.7% |
| Cape Verdeans | 0.0 /100 | #296 | Tragic 7.7% |
| Pueblo | 0.0 /100 | #297 | Tragic 7.7% |
| Dutch | 0.0 /100 | #298 | Tragic 7.7% |
| Germans | 0.0 /100 | #299 | Tragic 7.7% |
Demographics Similar to Australians by Disability Age 18 to 34
In terms of disability age 18 to 34, the demographic groups most similar to Australians are Estonian (6.8%, a difference of 0.13%), Kenyan (6.8%, a difference of 0.13%), Immigrants from Netherlands (6.7%, a difference of 0.16%), Sierra Leonean (6.8%, a difference of 0.22%), and Mexican American Indian (6.7%, a difference of 0.29%).
| Demographics | Rating | Rank | Disability Age 18 to 34 |
| Immigrants | Eastern Africa | 33.2 /100 | #191 | Fair 6.7% |
| Immigrants | Western Africa | 28.3 /100 | #192 | Fair 6.7% |
| Immigrants | Uganda | 25.1 /100 | #193 | Fair 6.7% |
| Immigrants | Sudan | 24.9 /100 | #194 | Fair 6.7% |
| Mexican American Indians | 22.3 /100 | #195 | Fair 6.7% |
| Immigrants | Netherlands | 21.0 /100 | #196 | Fair 6.7% |
| Estonians | 20.6 /100 | #197 | Fair 6.8% |
| Australians | 19.4 /100 | #198 | Poor 6.8% |
| Kenyans | 18.3 /100 | #199 | Poor 6.8% |
| Sierra Leoneans | 17.5 /100 | #200 | Poor 6.8% |
| Greeks | 16.1 /100 | #201 | Poor 6.8% |
| Panamanians | 15.8 /100 | #202 | Poor 6.8% |
| Hispanics or Latinos | 13.8 /100 | #203 | Poor 6.8% |
| Immigrants | Bosnia and Herzegovina | 13.6 /100 | #204 | Poor 6.8% |
| Lebanese | 13.3 /100 | #205 | Poor 6.8% |