Subsaharan African vs Australian Unemployment Among Youth under 25 years
COMPARE
Subsaharan African
Australian
Unemployment Among Youth under 25 years
Unemployment Among Youth under 25 years Comparison
Sub-Saharan Africans
Australians
12.6%
UNEMPLOYMENT AMONG YOUTH UNDER 25 YEARS
0.0/ 100
METRIC RATING
267th/ 347
METRIC RANK
10.9%
UNEMPLOYMENT AMONG YOUTH UNDER 25 YEARS
99.6/ 100
METRIC RATING
47th/ 347
METRIC RANK
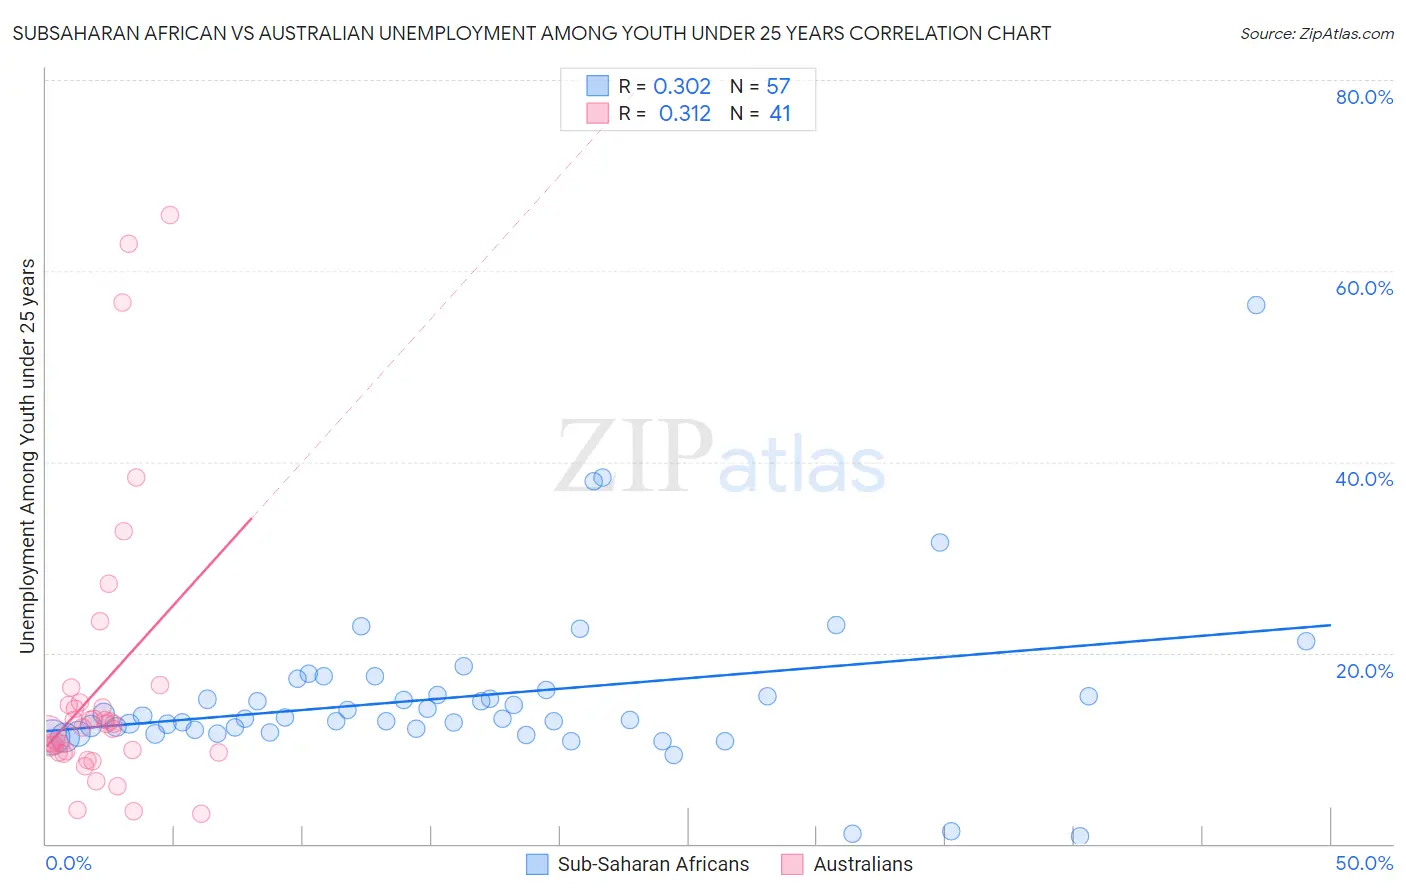
Subsaharan African vs Australian Unemployment Among Youth under 25 years Correlation Chart
The statistical analysis conducted on geographies consisting of 498,174,869 people shows a mild positive correlation between the proportion of Sub-Saharan Africans and unemployment rate among youth under the age of 25 in the United States with a correlation coefficient (R) of 0.302 and weighted average of 12.6%. Similarly, the statistical analysis conducted on geographies consisting of 222,175,762 people shows a mild positive correlation between the proportion of Australians and unemployment rate among youth under the age of 25 in the United States with a correlation coefficient (R) of 0.312 and weighted average of 10.9%, a difference of 15.5%.
Unemployment Among Youth under 25 years Correlation Summary
| Measurement | Subsaharan African | Australian |
| Minimum | 0.80% | 3.2% |
| Maximum | 56.4% | 65.8% |
| Range | 55.6% | 62.6% |
| Mean | 15.4% | 16.4% |
| Median | 13.1% | 12.2% |
| Interquartile 25% (IQ1) | 11.8% | 9.6% |
| Interquartile 75% (IQ3) | 15.8% | 14.6% |
| Interquartile Range (IQR) | 4.0% | 5.1% |
| Standard Deviation (Sample) | 8.6% | 14.7% |
| Standard Deviation (Population) | 8.6% | 14.5% |
Similar Demographics by Unemployment Among Youth under 25 years
Demographics Similar to Sub-Saharan Africans by Unemployment Among Youth under 25 years
In terms of unemployment among youth under 25 years, the demographic groups most similar to Sub-Saharan Africans are Tlingit-Haida (12.7%, a difference of 0.080%), Immigrants from Latin America (12.6%, a difference of 0.13%), Kiowa (12.7%, a difference of 0.20%), Nepalese (12.5%, a difference of 1.0%), and Puget Sound Salish (12.5%, a difference of 1.1%).
| Demographics | Rating | Rank | Unemployment Among Youth under 25 years |
| Immigrants | Panama | 0.1 /100 | #260 | Tragic 12.4% |
| Immigrants | El Salvador | 0.1 /100 | #261 | Tragic 12.4% |
| Immigrants | Mexico | 0.1 /100 | #262 | Tragic 12.4% |
| Cree | 0.1 /100 | #263 | Tragic 12.4% |
| Puget Sound Salish | 0.1 /100 | #264 | Tragic 12.5% |
| Nepalese | 0.0 /100 | #265 | Tragic 12.5% |
| Immigrants | Latin America | 0.0 /100 | #266 | Tragic 12.6% |
| Sub-Saharan Africans | 0.0 /100 | #267 | Tragic 12.6% |
| Tlingit-Haida | 0.0 /100 | #268 | Tragic 12.7% |
| Kiowa | 0.0 /100 | #269 | Tragic 12.7% |
| Immigrants | Liberia | 0.0 /100 | #270 | Tragic 12.8% |
| Immigrants | Bahamas | 0.0 /100 | #271 | Tragic 12.9% |
| Cape Verdeans | 0.0 /100 | #272 | Tragic 12.9% |
| Nigerians | 0.0 /100 | #273 | Tragic 13.0% |
| Immigrants | Nigeria | 0.0 /100 | #274 | Tragic 13.0% |
Demographics Similar to Australians by Unemployment Among Youth under 25 years
In terms of unemployment among youth under 25 years, the demographic groups most similar to Australians are Tongan (10.9%, a difference of 0.040%), Bulgarian (10.9%, a difference of 0.080%), Welsh (10.9%, a difference of 0.19%), British (10.9%, a difference of 0.21%), and Cambodian (10.9%, a difference of 0.47%).
| Demographics | Rating | Rank | Unemployment Among Youth under 25 years |
| Scottish | 99.8 /100 | #40 | Exceptional 10.9% |
| Croatians | 99.8 /100 | #41 | Exceptional 10.9% |
| Cambodians | 99.7 /100 | #42 | Exceptional 10.9% |
| British | 99.7 /100 | #43 | Exceptional 10.9% |
| Welsh | 99.7 /100 | #44 | Exceptional 10.9% |
| Bulgarians | 99.6 /100 | #45 | Exceptional 10.9% |
| Tongans | 99.6 /100 | #46 | Exceptional 10.9% |
| Australians | 99.6 /100 | #47 | Exceptional 10.9% |
| Poles | 99.3 /100 | #48 | Exceptional 11.0% |
| Thais | 99.3 /100 | #49 | Exceptional 11.0% |
| Czechoslovakians | 99.2 /100 | #50 | Exceptional 11.0% |
| Serbians | 99.0 /100 | #51 | Exceptional 11.0% |
| Latvians | 99.0 /100 | #52 | Exceptional 11.0% |
| Ottawa | 99.0 /100 | #53 | Exceptional 11.1% |
| Mongolians | 98.9 /100 | #54 | Exceptional 11.1% |