Spanish vs Immigrants from Latvia Bachelor's Degree
COMPARE
Spanish
Immigrants from Latvia
Bachelor's Degree
Bachelor's Degree Comparison
Spanish
Immigrants from Latvia
35.8%
BACHELOR'S DEGREE
9.6/ 100
METRIC RATING
220th/ 347
METRIC RANK
45.1%
BACHELOR'S DEGREE
100.0/ 100
METRIC RATING
39th/ 347
METRIC RANK
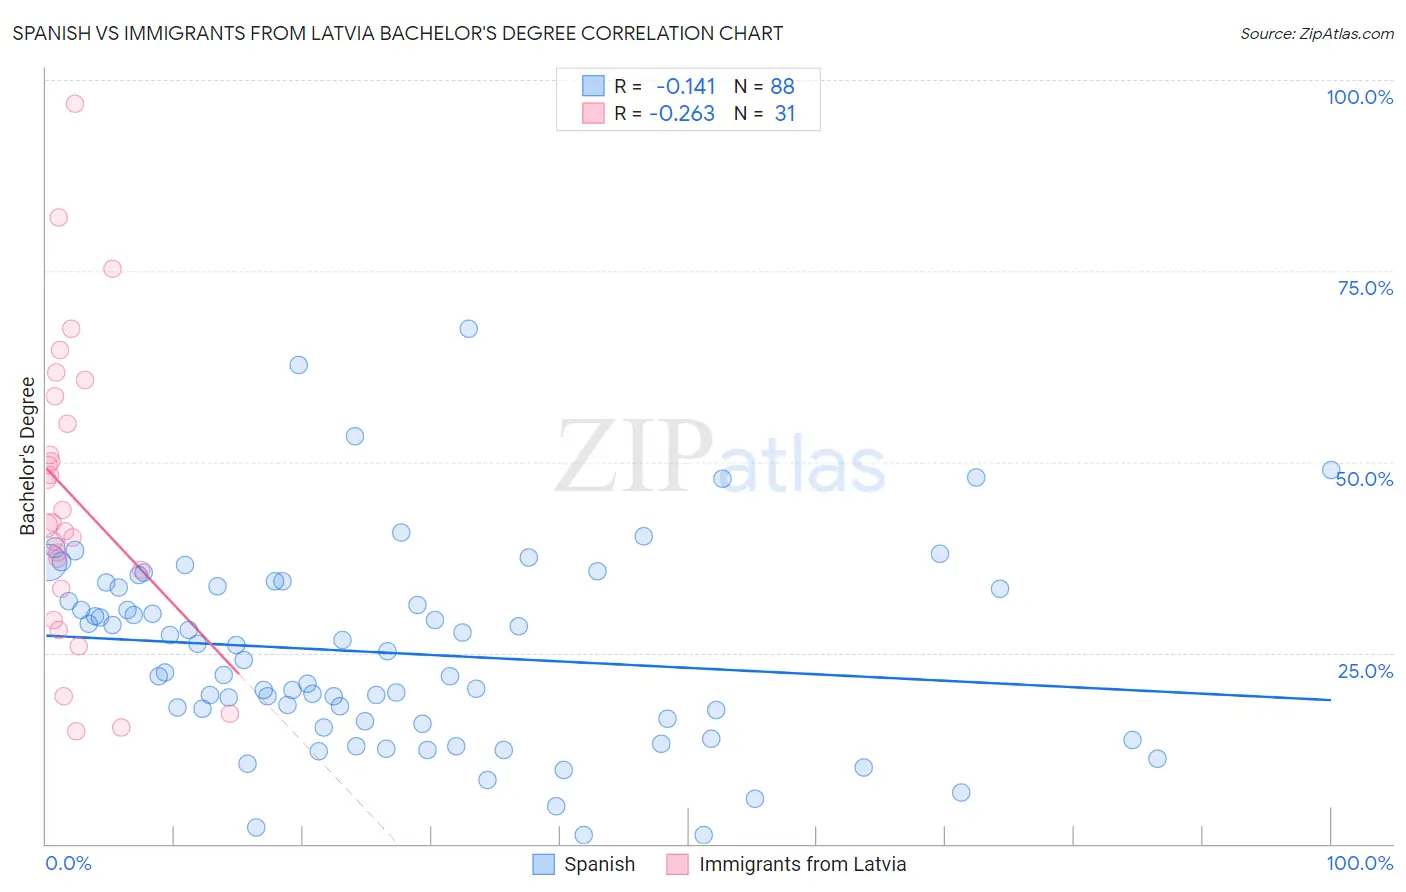
Spanish vs Immigrants from Latvia Bachelor's Degree Correlation Chart
The statistical analysis conducted on geographies consisting of 422,162,490 people shows a poor negative correlation between the proportion of Spanish and percentage of population with at least bachelor's degree education in the United States with a correlation coefficient (R) of -0.141 and weighted average of 35.8%. Similarly, the statistical analysis conducted on geographies consisting of 113,735,345 people shows a weak negative correlation between the proportion of Immigrants from Latvia and percentage of population with at least bachelor's degree education in the United States with a correlation coefficient (R) of -0.263 and weighted average of 45.1%, a difference of 26.2%.
Bachelor's Degree Correlation Summary
| Measurement | Spanish | Immigrants from Latvia |
| Minimum | 1.1% | 14.7% |
| Maximum | 67.4% | 96.9% |
| Range | 66.3% | 82.2% |
| Mean | 25.0% | 45.5% |
| Median | 23.3% | 42.0% |
| Interquartile 25% (IQ1) | 15.9% | 33.3% |
| Interquartile 75% (IQ3) | 33.6% | 58.6% |
| Interquartile Range (IQR) | 17.8% | 25.3% |
| Standard Deviation (Sample) | 12.9% | 19.4% |
| Standard Deviation (Population) | 12.9% | 19.1% |
Similar Demographics by Bachelor's Degree
Demographics Similar to Spanish by Bachelor's Degree
In terms of bachelor's degree, the demographic groups most similar to Spanish are West Indian (35.8%, a difference of 0.040%), Subsaharan African (35.8%, a difference of 0.070%), Dutch (35.7%, a difference of 0.11%), German Russian (35.8%, a difference of 0.17%), and Trinidadian and Tobagonian (35.7%, a difference of 0.25%).
| Demographics | Rating | Rank | Bachelor's Degree |
| Immigrants | Panama | 14.2 /100 | #213 | Poor 36.2% |
| Germans | 13.9 /100 | #214 | Poor 36.1% |
| Immigrants | Western Africa | 13.8 /100 | #215 | Poor 36.1% |
| Barbadians | 13.5 /100 | #216 | Poor 36.1% |
| German Russians | 10.2 /100 | #217 | Poor 35.8% |
| Sub-Saharan Africans | 9.8 /100 | #218 | Tragic 35.8% |
| West Indians | 9.7 /100 | #219 | Tragic 35.8% |
| Spanish | 9.6 /100 | #220 | Tragic 35.8% |
| Dutch | 9.2 /100 | #221 | Tragic 35.7% |
| Trinidadians and Tobagonians | 8.8 /100 | #222 | Tragic 35.7% |
| French Canadians | 8.3 /100 | #223 | Tragic 35.6% |
| Immigrants | Barbados | 7.5 /100 | #224 | Tragic 35.5% |
| Immigrants | Burma/Myanmar | 7.3 /100 | #225 | Tragic 35.5% |
| Portuguese | 7.2 /100 | #226 | Tragic 35.5% |
| Ecuadorians | 6.6 /100 | #227 | Tragic 35.4% |
Demographics Similar to Immigrants from Latvia by Bachelor's Degree
In terms of bachelor's degree, the demographic groups most similar to Immigrants from Latvia are Immigrants from Belarus (45.0%, a difference of 0.27%), Immigrants from Malaysia (45.0%, a difference of 0.31%), Bulgarian (45.3%, a difference of 0.33%), Russian (45.3%, a difference of 0.42%), and Mongolian (45.4%, a difference of 0.57%).
| Demographics | Rating | Rank | Bachelor's Degree |
| Immigrants | Turkey | 100.0 /100 | #32 | Exceptional 46.0% |
| Immigrants | Northern Europe | 100.0 /100 | #33 | Exceptional 45.6% |
| Immigrants | Denmark | 100.0 /100 | #34 | Exceptional 45.4% |
| Immigrants | Russia | 100.0 /100 | #35 | Exceptional 45.4% |
| Mongolians | 100.0 /100 | #36 | Exceptional 45.4% |
| Russians | 100.0 /100 | #37 | Exceptional 45.3% |
| Bulgarians | 100.0 /100 | #38 | Exceptional 45.3% |
| Immigrants | Latvia | 100.0 /100 | #39 | Exceptional 45.1% |
| Immigrants | Belarus | 100.0 /100 | #40 | Exceptional 45.0% |
| Immigrants | Malaysia | 100.0 /100 | #41 | Exceptional 45.0% |
| Immigrants | Saudi Arabia | 100.0 /100 | #42 | Exceptional 44.8% |
| Immigrants | South Africa | 99.9 /100 | #43 | Exceptional 44.8% |
| Immigrants | Lithuania | 99.9 /100 | #44 | Exceptional 44.6% |
| Immigrants | Kuwait | 99.9 /100 | #45 | Exceptional 44.6% |
| Immigrants | Bulgaria | 99.9 /100 | #46 | Exceptional 44.6% |