Spaniard vs Belizean 2nd Grade
COMPARE
Spaniard
Belizean
2nd Grade
2nd Grade Comparison
Spaniards
Belizeans
98.0%
2ND GRADE
90.7/ 100
METRIC RATING
132nd/ 347
METRIC RANK
96.8%
2ND GRADE
0.0/ 100
METRIC RATING
309th/ 347
METRIC RANK
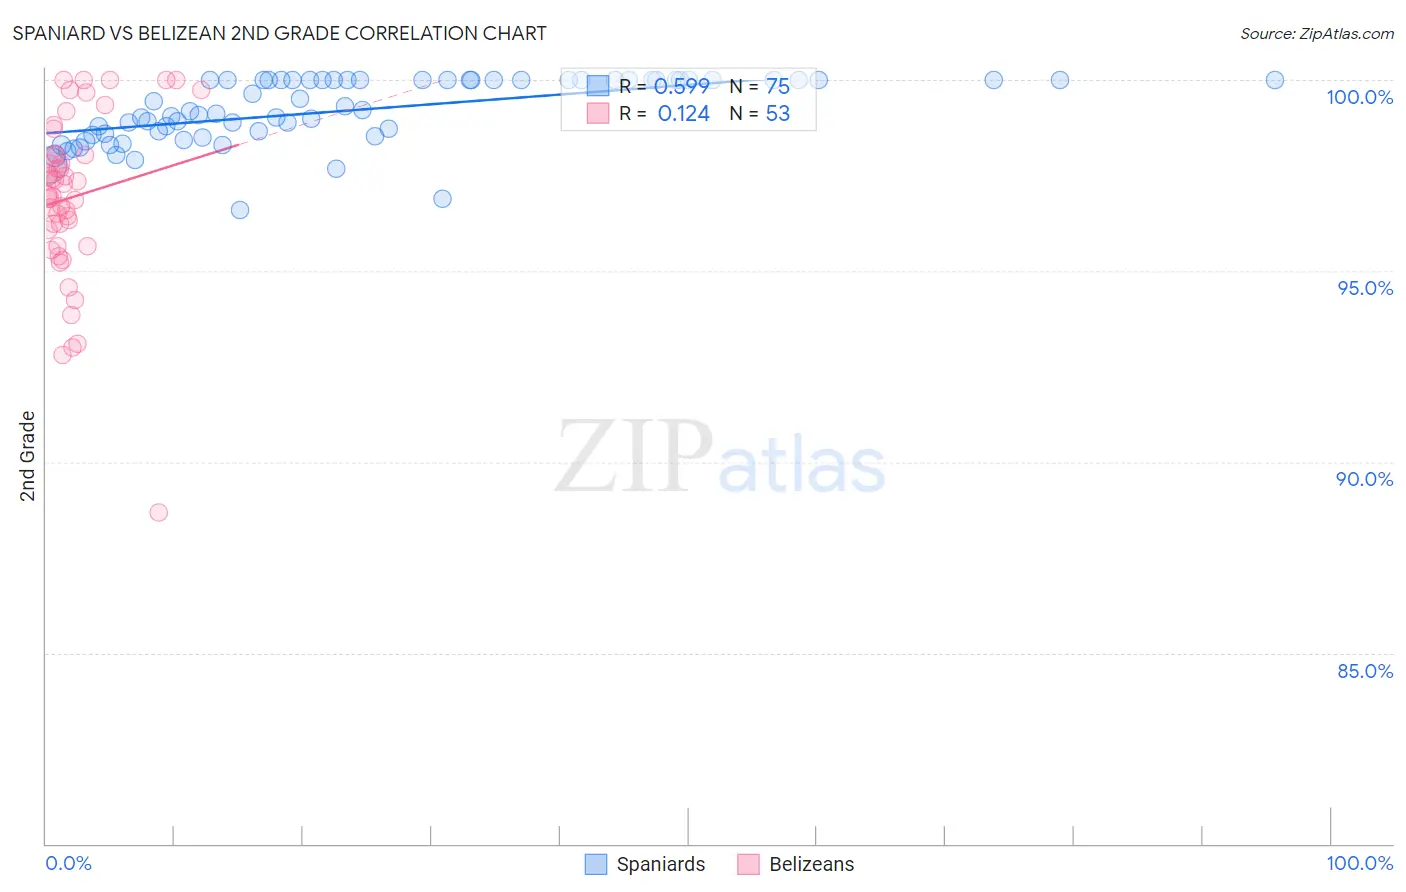
Spaniard vs Belizean 2nd Grade Correlation Chart
The statistical analysis conducted on geographies consisting of 443,544,503 people shows a substantial positive correlation between the proportion of Spaniards and percentage of population with at least 2nd grade education in the United States with a correlation coefficient (R) of 0.599 and weighted average of 98.0%. Similarly, the statistical analysis conducted on geographies consisting of 144,224,236 people shows a poor positive correlation between the proportion of Belizeans and percentage of population with at least 2nd grade education in the United States with a correlation coefficient (R) of 0.124 and weighted average of 96.8%, a difference of 1.3%.
2nd Grade Correlation Summary
| Measurement | Spaniard | Belizean |
| Minimum | 96.6% | 88.7% |
| Maximum | 100.0% | 100.0% |
| Range | 3.4% | 11.3% |
| Mean | 99.2% | 96.9% |
| Median | 99.2% | 97.0% |
| Interquartile 25% (IQ1) | 98.6% | 95.9% |
| Interquartile 75% (IQ3) | 100.0% | 98.1% |
| Interquartile Range (IQR) | 1.4% | 2.2% |
| Standard Deviation (Sample) | 0.85% | 2.2% |
| Standard Deviation (Population) | 0.84% | 2.2% |
Similar Demographics by 2nd Grade
Demographics Similar to Spaniards by 2nd Grade
In terms of 2nd grade, the demographic groups most similar to Spaniards are Seminole (98.0%, a difference of 0.0%), Immigrants from Europe (98.0%, a difference of 0.0%), Cambodian (98.0%, a difference of 0.0%), Immigrants from Croatia (98.1%, a difference of 0.010%), and Immigrants from Hungary (98.0%, a difference of 0.010%).
| Demographics | Rating | Rank | 2nd Grade |
| Iroquois | 94.1 /100 | #125 | Exceptional 98.1% |
| Syrians | 94.0 /100 | #126 | Exceptional 98.1% |
| Immigrants | Saudi Arabia | 93.6 /100 | #127 | Exceptional 98.1% |
| Immigrants | Serbia | 92.3 /100 | #128 | Exceptional 98.1% |
| Immigrants | Croatia | 92.1 /100 | #129 | Exceptional 98.1% |
| Seminole | 91.1 /100 | #130 | Exceptional 98.0% |
| Immigrants | Europe | 91.1 /100 | #131 | Exceptional 98.0% |
| Spaniards | 90.7 /100 | #132 | Exceptional 98.0% |
| Cambodians | 90.7 /100 | #133 | Exceptional 98.0% |
| Immigrants | Hungary | 89.7 /100 | #134 | Excellent 98.0% |
| Immigrants | Bulgaria | 89.7 /100 | #135 | Excellent 98.0% |
| Immigrants | Kuwait | 89.2 /100 | #136 | Excellent 98.0% |
| Immigrants | Romania | 88.3 /100 | #137 | Excellent 98.0% |
| Israelis | 87.9 /100 | #138 | Excellent 98.0% |
| Blackfeet | 87.5 /100 | #139 | Excellent 98.0% |
Demographics Similar to Belizeans by 2nd Grade
In terms of 2nd grade, the demographic groups most similar to Belizeans are Sri Lankan (96.8%, a difference of 0.0%), Immigrants from the Azores (96.8%, a difference of 0.010%), Immigrants from Haiti (96.8%, a difference of 0.010%), Guyanese (96.8%, a difference of 0.010%), and Cape Verdean (96.8%, a difference of 0.020%).
| Demographics | Rating | Rank | 2nd Grade |
| Somalis | 0.0 /100 | #302 | Tragic 97.0% |
| Ecuadorians | 0.0 /100 | #303 | Tragic 96.9% |
| Immigrants | Caribbean | 0.0 /100 | #304 | Tragic 96.9% |
| Nicaraguans | 0.0 /100 | #305 | Tragic 96.9% |
| Immigrants | Somalia | 0.0 /100 | #306 | Tragic 96.9% |
| Immigrants | Azores | 0.0 /100 | #307 | Tragic 96.8% |
| Immigrants | Haiti | 0.0 /100 | #308 | Tragic 96.8% |
| Belizeans | 0.0 /100 | #309 | Tragic 96.8% |
| Sri Lankans | 0.0 /100 | #310 | Tragic 96.8% |
| Guyanese | 0.0 /100 | #311 | Tragic 96.8% |
| Cape Verdeans | 0.0 /100 | #312 | Tragic 96.8% |
| Hispanics or Latinos | 0.0 /100 | #313 | Tragic 96.8% |
| Immigrants | Ecuador | 0.0 /100 | #314 | Tragic 96.8% |
| Immigrants | Belize | 0.0 /100 | #315 | Tragic 96.8% |
| Hondurans | 0.0 /100 | #316 | Tragic 96.7% |