Spaniard vs Belizean Male Poverty
COMPARE
Spaniard
Belizean
Male Poverty
Male Poverty Comparison
Spaniards
Belizeans
11.7%
MALE POVERTY
13.5/ 100
METRIC RATING
201st/ 347
METRIC RANK
13.6%
MALE POVERTY
0.0/ 100
METRIC RATING
278th/ 347
METRIC RANK
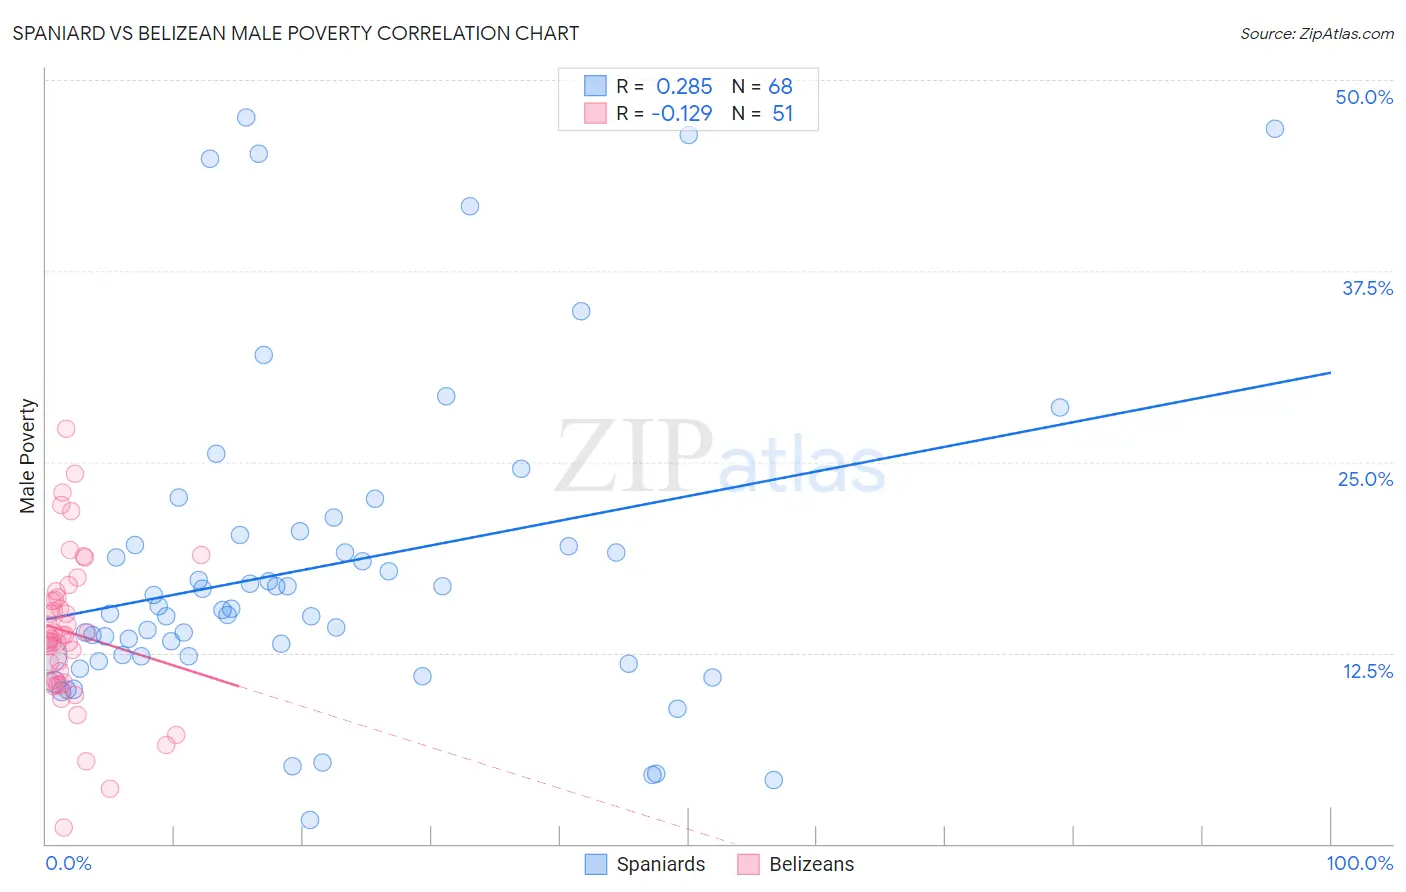
Spaniard vs Belizean Male Poverty Correlation Chart
The statistical analysis conducted on geographies consisting of 442,977,200 people shows a weak positive correlation between the proportion of Spaniards and poverty level among males in the United States with a correlation coefficient (R) of 0.285 and weighted average of 11.7%. Similarly, the statistical analysis conducted on geographies consisting of 144,147,961 people shows a poor negative correlation between the proportion of Belizeans and poverty level among males in the United States with a correlation coefficient (R) of -0.129 and weighted average of 13.6%, a difference of 16.7%.
Male Poverty Correlation Summary
| Measurement | Spaniard | Belizean |
| Minimum | 1.5% | 1.1% |
| Maximum | 47.5% | 27.1% |
| Range | 46.0% | 26.0% |
| Mean | 18.1% | 13.8% |
| Median | 15.3% | 13.5% |
| Interquartile 25% (IQ1) | 12.3% | 10.7% |
| Interquartile 75% (IQ3) | 19.9% | 16.2% |
| Interquartile Range (IQR) | 7.6% | 5.5% |
| Standard Deviation (Sample) | 10.6% | 5.0% |
| Standard Deviation (Population) | 10.5% | 4.9% |
Similar Demographics by Male Poverty
Demographics Similar to Spaniards by Male Poverty
In terms of male poverty, the demographic groups most similar to Spaniards are Immigrants from Lebanon (11.7%, a difference of 0.010%), Spanish (11.7%, a difference of 0.11%), Iraqi (11.7%, a difference of 0.22%), Delaware (11.7%, a difference of 0.36%), and Arab (11.6%, a difference of 0.42%).
| Demographics | Rating | Rank | Male Poverty |
| Immigrants | Kenya | 16.1 /100 | #194 | Poor 11.6% |
| Arabs | 15.8 /100 | #195 | Poor 11.6% |
| Hmong | 15.8 /100 | #196 | Poor 11.6% |
| Delaware | 15.4 /100 | #197 | Poor 11.7% |
| Iraqis | 14.7 /100 | #198 | Poor 11.7% |
| Spanish | 14.1 /100 | #199 | Poor 11.7% |
| Immigrants | Lebanon | 13.6 /100 | #200 | Poor 11.7% |
| Spaniards | 13.5 /100 | #201 | Poor 11.7% |
| Aleuts | 10.4 /100 | #202 | Poor 11.8% |
| Immigrants | Western Asia | 9.8 /100 | #203 | Tragic 11.8% |
| Immigrants | Uganda | 8.5 /100 | #204 | Tragic 11.8% |
| Panamanians | 6.2 /100 | #205 | Tragic 11.9% |
| Immigrants | Eastern Africa | 5.4 /100 | #206 | Tragic 12.0% |
| Malaysians | 5.2 /100 | #207 | Tragic 12.0% |
| Immigrants | Immigrants | 4.5 /100 | #208 | Tragic 12.0% |
Demographics Similar to Belizeans by Male Poverty
In terms of male poverty, the demographic groups most similar to Belizeans are Bangladeshi (13.6%, a difference of 0.10%), Haitian (13.7%, a difference of 0.18%), Immigrants from Latin America (13.6%, a difference of 0.24%), Mexican (13.7%, a difference of 0.27%), and Yaqui (13.7%, a difference of 0.32%).
| Demographics | Rating | Rank | Male Poverty |
| Spanish Americans | 0.0 /100 | #271 | Tragic 13.4% |
| Immigrants | Bahamas | 0.0 /100 | #272 | Tragic 13.5% |
| Chickasaw | 0.0 /100 | #273 | Tragic 13.5% |
| Immigrants | West Indies | 0.0 /100 | #274 | Tragic 13.5% |
| Barbadians | 0.0 /100 | #275 | Tragic 13.6% |
| Immigrants | Latin America | 0.0 /100 | #276 | Tragic 13.6% |
| Bangladeshis | 0.0 /100 | #277 | Tragic 13.6% |
| Belizeans | 0.0 /100 | #278 | Tragic 13.6% |
| Haitians | 0.0 /100 | #279 | Tragic 13.7% |
| Mexicans | 0.0 /100 | #280 | Tragic 13.7% |
| Yaqui | 0.0 /100 | #281 | Tragic 13.7% |
| Immigrants | Cabo Verde | 0.0 /100 | #282 | Tragic 13.7% |
| Comanche | 0.0 /100 | #283 | Tragic 13.8% |
| Immigrants | Haiti | 0.0 /100 | #284 | Tragic 13.8% |
| West Indians | 0.0 /100 | #285 | Tragic 13.8% |