Creek vs Belizean Self-Care Disability
COMPARE
Creek
Belizean
Self-Care Disability
Self-Care Disability Comparison
Creek
Belizeans
2.8%
SELF-CARE DISABILITY
0.0/ 100
METRIC RATING
314th/ 347
METRIC RANK
2.7%
SELF-CARE DISABILITY
0.0/ 100
METRIC RATING
293rd/ 347
METRIC RANK
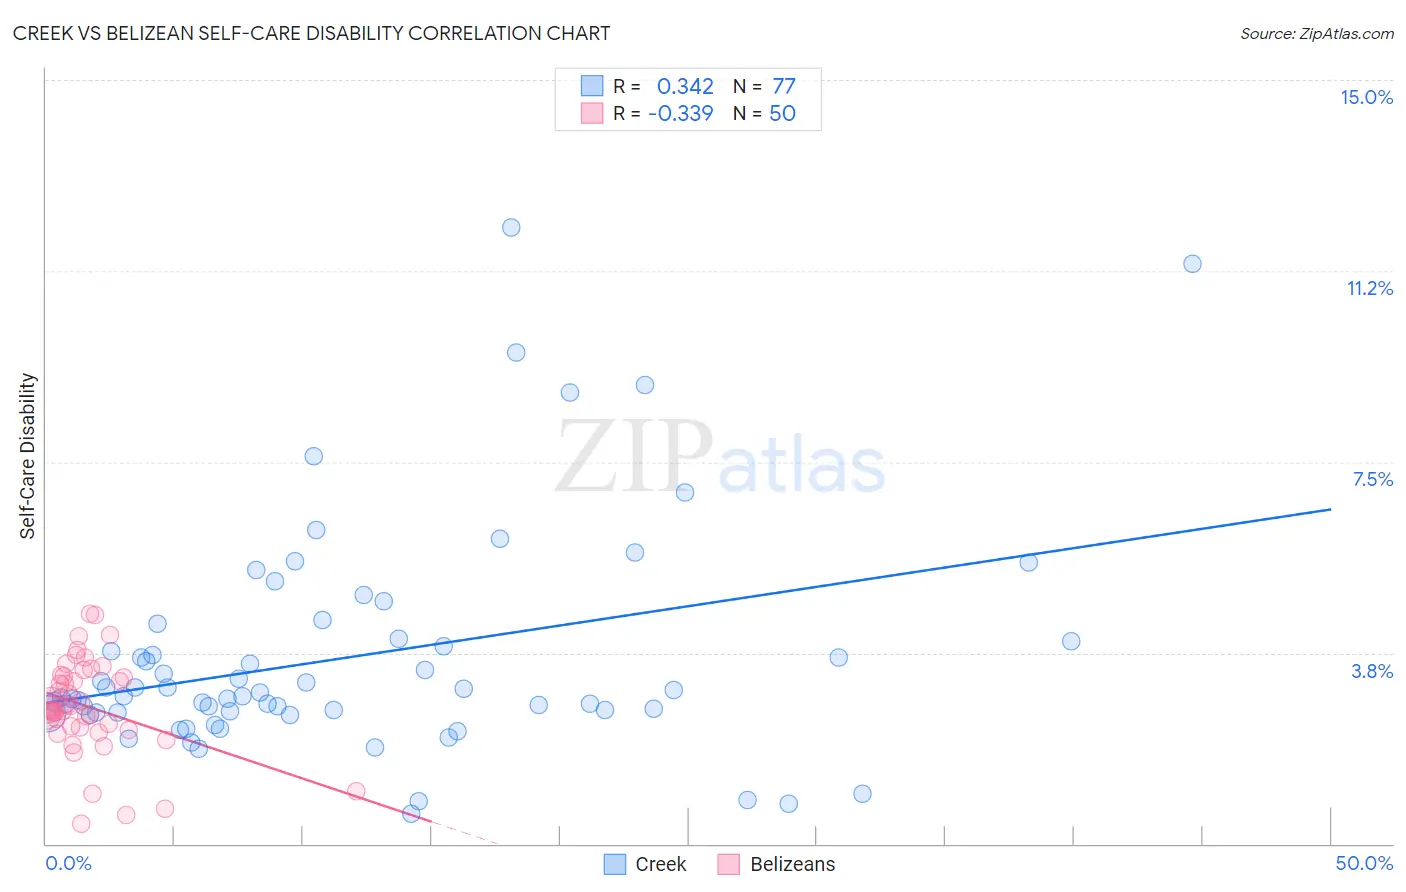
Creek vs Belizean Self-Care Disability Correlation Chart
The statistical analysis conducted on geographies consisting of 178,379,870 people shows a mild positive correlation between the proportion of Creek and percentage of population with self-care disability in the United States with a correlation coefficient (R) of 0.342 and weighted average of 2.8%. Similarly, the statistical analysis conducted on geographies consisting of 144,103,033 people shows a mild negative correlation between the proportion of Belizeans and percentage of population with self-care disability in the United States with a correlation coefficient (R) of -0.339 and weighted average of 2.7%, a difference of 3.4%.
Self-Care Disability Correlation Summary
| Measurement | Creek | Belizean |
| Minimum | 0.58% | 0.38% |
| Maximum | 12.1% | 4.5% |
| Range | 11.5% | 4.1% |
| Mean | 3.7% | 2.7% |
| Median | 2.9% | 2.7% |
| Interquartile 25% (IQ1) | 2.6% | 2.3% |
| Interquartile 75% (IQ3) | 4.0% | 3.3% |
| Interquartile Range (IQR) | 1.4% | 1.0% |
| Standard Deviation (Sample) | 2.2% | 0.92% |
| Standard Deviation (Population) | 2.2% | 0.91% |
Similar Demographics by Self-Care Disability
Demographics Similar to Creek by Self-Care Disability
In terms of self-care disability, the demographic groups most similar to Creek are Immigrants from Cuba (2.8%, a difference of 0.21%), Spanish American (2.8%, a difference of 0.22%), Immigrants from Caribbean (2.8%, a difference of 0.25%), Menominee (2.8%, a difference of 0.32%), and Immigrants from Dominica (2.8%, a difference of 0.44%).
| Demographics | Rating | Rank | Self-Care Disability |
| Natives/Alaskans | 0.0 /100 | #307 | Tragic 2.8% |
| Immigrants | Grenada | 0.0 /100 | #308 | Tragic 2.8% |
| Bangladeshis | 0.0 /100 | #309 | Tragic 2.8% |
| British West Indians | 0.0 /100 | #310 | Tragic 2.8% |
| Puget Sound Salish | 0.0 /100 | #311 | Tragic 2.8% |
| Immigrants | Caribbean | 0.0 /100 | #312 | Tragic 2.8% |
| Spanish Americans | 0.0 /100 | #313 | Tragic 2.8% |
| Creek | 0.0 /100 | #314 | Tragic 2.8% |
| Immigrants | Cuba | 0.0 /100 | #315 | Tragic 2.8% |
| Menominee | 0.0 /100 | #316 | Tragic 2.8% |
| Immigrants | Dominica | 0.0 /100 | #317 | Tragic 2.8% |
| Assyrians/Chaldeans/Syriacs | 0.0 /100 | #318 | Tragic 2.8% |
| Spanish American Indians | 0.0 /100 | #319 | Tragic 2.9% |
| Chickasaw | 0.0 /100 | #320 | Tragic 2.9% |
| Navajo | 0.0 /100 | #321 | Tragic 2.9% |
Demographics Similar to Belizeans by Self-Care Disability
In terms of self-care disability, the demographic groups most similar to Belizeans are Central American Indian (2.7%, a difference of 0.0%), Blackfeet (2.7%, a difference of 0.010%), Barbadian (2.7%, a difference of 0.15%), Guyanese (2.7%, a difference of 0.16%), and Cuban (2.7%, a difference of 0.42%).
| Demographics | Rating | Rank | Self-Care Disability |
| French American Indians | 0.0 /100 | #286 | Tragic 2.7% |
| Immigrants | Jamaica | 0.0 /100 | #287 | Tragic 2.7% |
| Immigrants | Barbados | 0.0 /100 | #288 | Tragic 2.7% |
| Africans | 0.0 /100 | #289 | Tragic 2.7% |
| Cubans | 0.0 /100 | #290 | Tragic 2.7% |
| Guyanese | 0.0 /100 | #291 | Tragic 2.7% |
| Central American Indians | 0.0 /100 | #292 | Tragic 2.7% |
| Belizeans | 0.0 /100 | #293 | Tragic 2.7% |
| Blackfeet | 0.0 /100 | #294 | Tragic 2.7% |
| Barbadians | 0.0 /100 | #295 | Tragic 2.7% |
| Immigrants | Portugal | 0.0 /100 | #296 | Tragic 2.8% |
| West Indians | 0.0 /100 | #297 | Tragic 2.8% |
| Americans | 0.0 /100 | #298 | Tragic 2.8% |
| Immigrants | Guyana | 0.0 /100 | #299 | Tragic 2.8% |
| Immigrants | Fiji | 0.0 /100 | #300 | Tragic 2.8% |