Immigrants from Cabo Verde vs New Zealander Self-Care Disability
COMPARE
Immigrants from Cabo Verde
New Zealander
Self-Care Disability
Self-Care Disability Comparison
Immigrants from Cabo Verde
New Zealanders
3.1%
SELF-CARE DISABILITY
0.0/ 100
METRIC RATING
340th/ 347
METRIC RANK
2.3%
SELF-CARE DISABILITY
99.5/ 100
METRIC RATING
59th/ 347
METRIC RANK
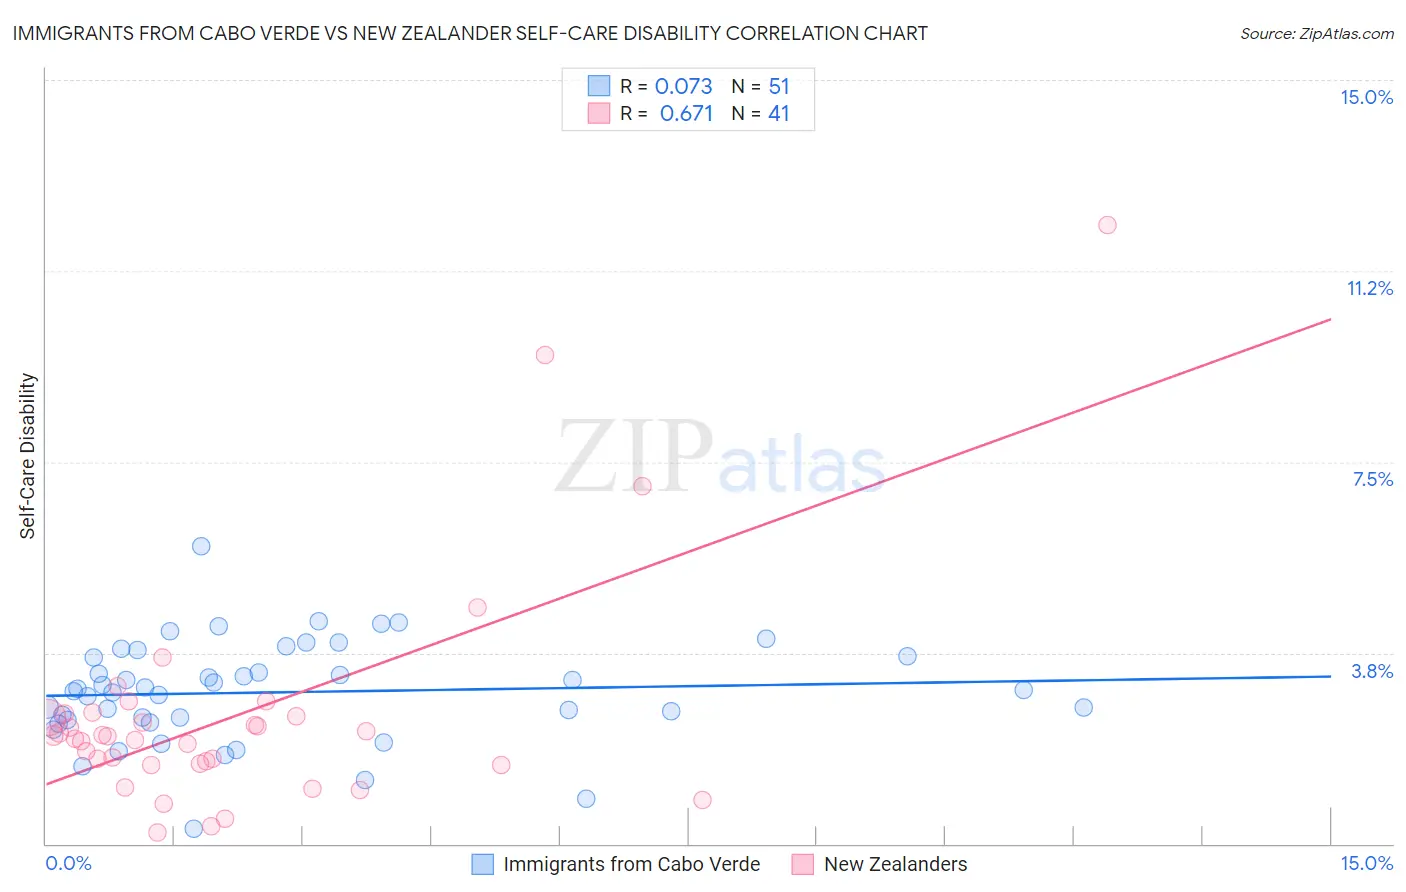
Immigrants from Cabo Verde vs New Zealander Self-Care Disability Correlation Chart
The statistical analysis conducted on geographies consisting of 38,125,014 people shows a slight positive correlation between the proportion of Immigrants from Cabo Verde and percentage of population with self-care disability in the United States with a correlation coefficient (R) of 0.073 and weighted average of 3.1%. Similarly, the statistical analysis conducted on geographies consisting of 106,879,653 people shows a significant positive correlation between the proportion of New Zealanders and percentage of population with self-care disability in the United States with a correlation coefficient (R) of 0.671 and weighted average of 2.3%, a difference of 32.3%.
Self-Care Disability Correlation Summary
| Measurement | Immigrants from Cabo Verde | New Zealander |
| Minimum | 0.30% | 0.21% |
| Maximum | 5.8% | 12.2% |
| Range | 5.5% | 11.9% |
| Mean | 3.0% | 2.5% |
| Median | 3.0% | 2.1% |
| Interquartile 25% (IQ1) | 2.4% | 1.6% |
| Interquartile 75% (IQ3) | 3.7% | 2.5% |
| Interquartile Range (IQR) | 1.2% | 0.97% |
| Standard Deviation (Sample) | 1.00% | 2.3% |
| Standard Deviation (Population) | 0.99% | 2.2% |
Similar Demographics by Self-Care Disability
Demographics Similar to Immigrants from Cabo Verde by Self-Care Disability
In terms of self-care disability, the demographic groups most similar to Immigrants from Cabo Verde are Dominican (3.1%, a difference of 0.26%), Immigrants from Dominican Republic (3.0%, a difference of 0.33%), Cape Verdean (3.0%, a difference of 0.72%), Choctaw (3.0%, a difference of 1.0%), and Colville (3.1%, a difference of 1.9%).
| Demographics | Rating | Rank | Self-Care Disability |
| Dutch West Indians | 0.0 /100 | #333 | Tragic 3.0% |
| Houma | 0.0 /100 | #334 | Tragic 3.0% |
| Immigrants | Azores | 0.0 /100 | #335 | Tragic 3.0% |
| Immigrants | Yemen | 0.0 /100 | #336 | Tragic 3.0% |
| Choctaw | 0.0 /100 | #337 | Tragic 3.0% |
| Cape Verdeans | 0.0 /100 | #338 | Tragic 3.0% |
| Immigrants | Dominican Republic | 0.0 /100 | #339 | Tragic 3.0% |
| Immigrants | Cabo Verde | 0.0 /100 | #340 | Tragic 3.1% |
| Dominicans | 0.0 /100 | #341 | Tragic 3.1% |
| Colville | 0.0 /100 | #342 | Tragic 3.1% |
| Tohono O'odham | 0.0 /100 | #343 | Tragic 3.1% |
| Pueblo | 0.0 /100 | #344 | Tragic 3.3% |
| Armenians | 0.0 /100 | #345 | Tragic 3.4% |
| Puerto Ricans | 0.0 /100 | #346 | Tragic 3.7% |
| Immigrants | Armenia | 0.0 /100 | #347 | Tragic 4.2% |
Demographics Similar to New Zealanders by Self-Care Disability
In terms of self-care disability, the demographic groups most similar to New Zealanders are Immigrants from Cameroon (2.3%, a difference of 0.11%), Immigrants from Japan (2.3%, a difference of 0.14%), Immigrants from Belgium (2.3%, a difference of 0.18%), Immigrants from Eastern Asia (2.3%, a difference of 0.19%), and Immigrants from France (2.3%, a difference of 0.23%).
| Demographics | Rating | Rank | Self-Care Disability |
| Immigrants | Serbia | 99.6 /100 | #52 | Exceptional 2.3% |
| Australians | 99.6 /100 | #53 | Exceptional 2.3% |
| Argentineans | 99.6 /100 | #54 | Exceptional 2.3% |
| Immigrants | France | 99.6 /100 | #55 | Exceptional 2.3% |
| Immigrants | Eastern Asia | 99.6 /100 | #56 | Exceptional 2.3% |
| Immigrants | Belgium | 99.6 /100 | #57 | Exceptional 2.3% |
| Immigrants | Cameroon | 99.6 /100 | #58 | Exceptional 2.3% |
| New Zealanders | 99.5 /100 | #59 | Exceptional 2.3% |
| Immigrants | Japan | 99.5 /100 | #60 | Exceptional 2.3% |
| Palestinians | 99.4 /100 | #61 | Exceptional 2.3% |
| Egyptians | 99.4 /100 | #62 | Exceptional 2.3% |
| Mongolians | 99.3 /100 | #63 | Exceptional 2.3% |
| Swedes | 99.3 /100 | #64 | Exceptional 2.3% |
| Brazilians | 99.3 /100 | #65 | Exceptional 2.3% |
| Immigrants | Argentina | 99.3 /100 | #66 | Exceptional 2.3% |