Soviet Union vs New Zealander 11th Grade
COMPARE
Soviet Union
New Zealander
11th Grade
11th Grade Comparison
Soviet Union
New Zealanders
93.7%
11TH GRADE
99.5/ 100
METRIC RATING
78th/ 347
METRIC RANK
94.0%
11TH GRADE
99.9/ 100
METRIC RATING
57th/ 347
METRIC RANK
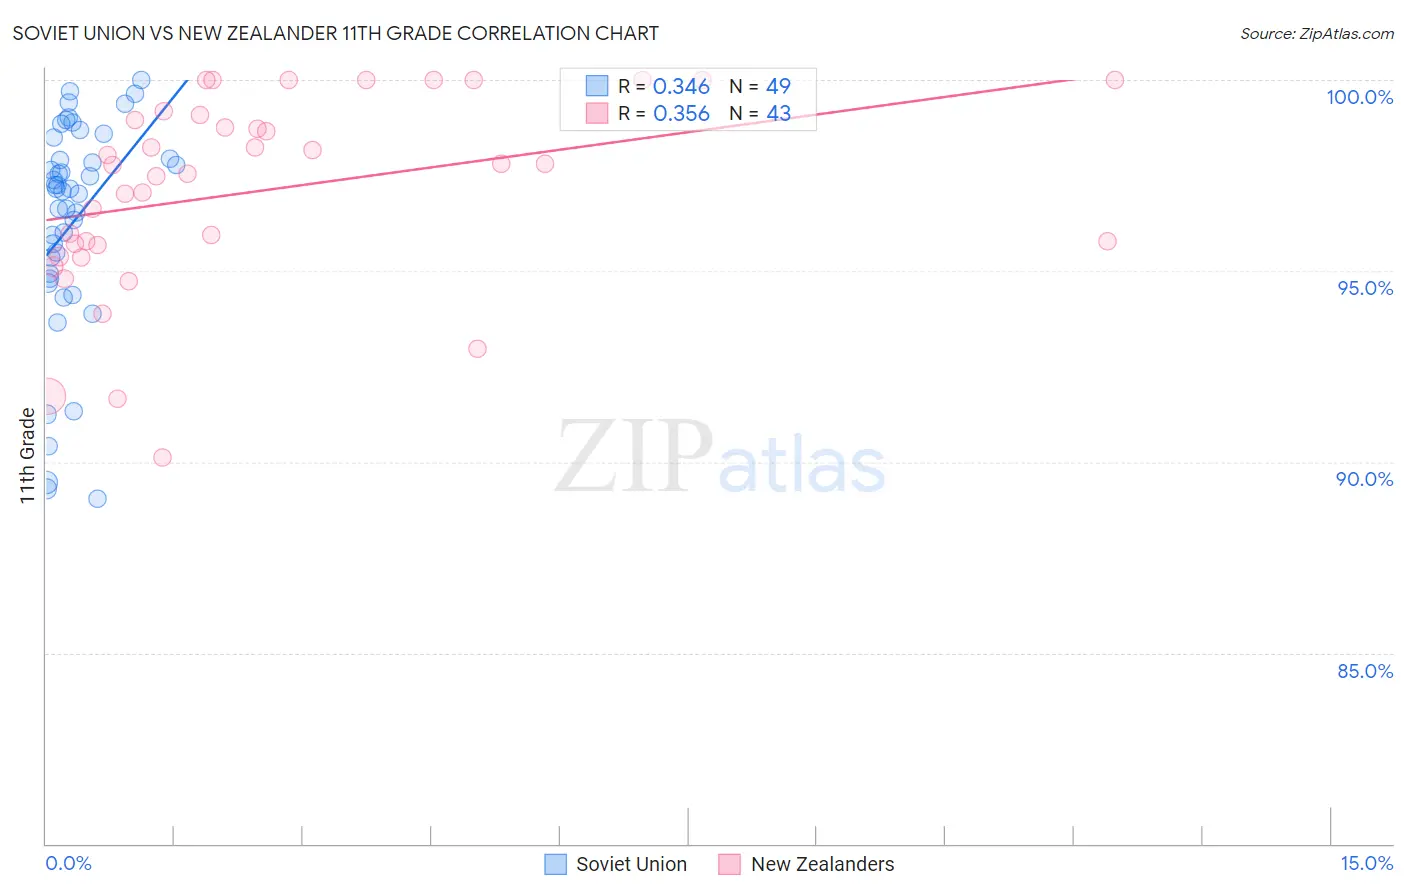
Soviet Union vs New Zealander 11th Grade Correlation Chart
The statistical analysis conducted on geographies consisting of 43,454,395 people shows a mild positive correlation between the proportion of Soviet Union and percentage of population with at least 11th grade education in the United States with a correlation coefficient (R) of 0.346 and weighted average of 93.7%. Similarly, the statistical analysis conducted on geographies consisting of 106,912,053 people shows a mild positive correlation between the proportion of New Zealanders and percentage of population with at least 11th grade education in the United States with a correlation coefficient (R) of 0.356 and weighted average of 94.0%, a difference of 0.28%.
11th Grade Correlation Summary
| Measurement | Soviet Union | New Zealander |
| Minimum | 89.0% | 90.1% |
| Maximum | 100.0% | 100.0% |
| Range | 11.0% | 9.9% |
| Mean | 96.3% | 97.1% |
| Median | 97.2% | 97.8% |
| Interquartile 25% (IQ1) | 94.9% | 95.7% |
| Interquartile 75% (IQ3) | 98.2% | 99.1% |
| Interquartile Range (IQR) | 3.4% | 3.4% |
| Standard Deviation (Sample) | 2.8% | 2.5% |
| Standard Deviation (Population) | 2.8% | 2.5% |
Similar Demographics by 11th Grade
Demographics Similar to Soviet Union by 11th Grade
In terms of 11th grade, the demographic groups most similar to Soviet Union are Aleut (93.7%, a difference of 0.0%), Celtic (93.7%, a difference of 0.010%), Immigrants from Denmark (93.7%, a difference of 0.010%), Immigrants from Latvia (93.8%, a difference of 0.030%), and Canadian (93.7%, a difference of 0.030%).
| Demographics | Rating | Rank | 11th Grade |
| Immigrants | South Africa | 99.7 /100 | #71 | Exceptional 93.8% |
| Immigrants | Japan | 99.7 /100 | #72 | Exceptional 93.8% |
| Romanians | 99.6 /100 | #73 | Exceptional 93.8% |
| Immigrants | Czechoslovakia | 99.6 /100 | #74 | Exceptional 93.8% |
| Immigrants | Latvia | 99.6 /100 | #75 | Exceptional 93.8% |
| Celtics | 99.5 /100 | #76 | Exceptional 93.7% |
| Aleuts | 99.5 /100 | #77 | Exceptional 93.7% |
| Soviet Union | 99.5 /100 | #78 | Exceptional 93.7% |
| Immigrants | Denmark | 99.5 /100 | #79 | Exceptional 93.7% |
| Canadians | 99.5 /100 | #80 | Exceptional 93.7% |
| Immigrants | Moldova | 99.5 /100 | #81 | Exceptional 93.7% |
| Immigrants | Saudi Arabia | 99.3 /100 | #82 | Exceptional 93.7% |
| Icelanders | 99.3 /100 | #83 | Exceptional 93.6% |
| Immigrants | Taiwan | 99.3 /100 | #84 | Exceptional 93.6% |
| Immigrants | Switzerland | 99.3 /100 | #85 | Exceptional 93.6% |
Demographics Similar to New Zealanders by 11th Grade
In terms of 11th grade, the demographic groups most similar to New Zealanders are French Canadian (94.0%, a difference of 0.0%), Iranian (94.0%, a difference of 0.0%), Bhutanese (94.0%, a difference of 0.0%), Okinawan (94.0%, a difference of 0.0%), and Immigrants from North America (94.0%, a difference of 0.010%).
| Demographics | Rating | Rank | 11th Grade |
| French | 99.9 /100 | #50 | Exceptional 94.1% |
| Turks | 99.9 /100 | #51 | Exceptional 94.0% |
| Immigrants | Canada | 99.9 /100 | #52 | Exceptional 94.0% |
| Immigrants | Australia | 99.9 /100 | #53 | Exceptional 94.0% |
| Immigrants | North America | 99.9 /100 | #54 | Exceptional 94.0% |
| Czechoslovakians | 99.9 /100 | #55 | Exceptional 94.0% |
| French Canadians | 99.9 /100 | #56 | Exceptional 94.0% |
| New Zealanders | 99.9 /100 | #57 | Exceptional 94.0% |
| Iranians | 99.9 /100 | #58 | Exceptional 94.0% |
| Bhutanese | 99.8 /100 | #59 | Exceptional 94.0% |
| Okinawans | 99.8 /100 | #60 | Exceptional 94.0% |
| Immigrants | Belgium | 99.8 /100 | #61 | Exceptional 94.0% |
| Austrians | 99.8 /100 | #62 | Exceptional 94.0% |
| Ukrainians | 99.8 /100 | #63 | Exceptional 94.0% |
| Immigrants | Sweden | 99.8 /100 | #64 | Exceptional 93.9% |