Mongolian vs Iraqi Self-Care Disability
COMPARE
Mongolian
Iraqi
Self-Care Disability
Self-Care Disability Comparison
Mongolians
Iraqis
2.3%
SELF-CARE DISABILITY
99.3/ 100
METRIC RATING
63rd/ 347
METRIC RANK
2.6%
SELF-CARE DISABILITY
3.2/ 100
METRIC RATING
225th/ 347
METRIC RANK
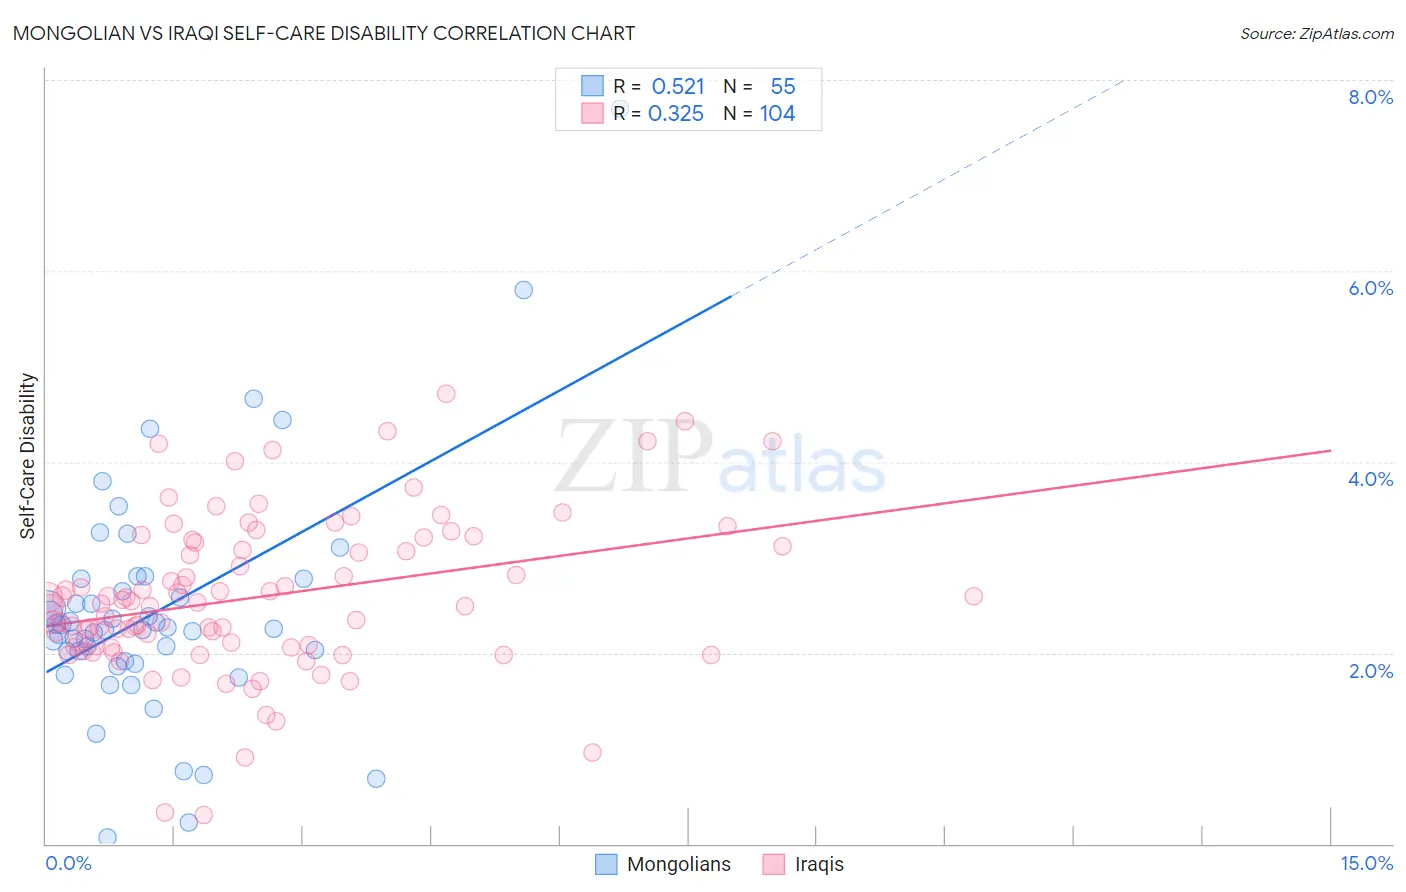
Mongolian vs Iraqi Self-Care Disability Correlation Chart
The statistical analysis conducted on geographies consisting of 140,258,079 people shows a substantial positive correlation between the proportion of Mongolians and percentage of population with self-care disability in the United States with a correlation coefficient (R) of 0.521 and weighted average of 2.3%. Similarly, the statistical analysis conducted on geographies consisting of 170,619,195 people shows a mild positive correlation between the proportion of Iraqis and percentage of population with self-care disability in the United States with a correlation coefficient (R) of 0.325 and weighted average of 2.6%, a difference of 10.7%.
Self-Care Disability Correlation Summary
| Measurement | Mongolian | Iraqi |
| Minimum | 0.065% | 0.30% |
| Maximum | 7.7% | 4.7% |
| Range | 7.6% | 4.4% |
| Mean | 2.4% | 2.6% |
| Median | 2.2% | 2.5% |
| Interquartile 25% (IQ1) | 1.9% | 2.1% |
| Interquartile 75% (IQ3) | 2.8% | 3.1% |
| Interquartile Range (IQR) | 0.86% | 1.1% |
| Standard Deviation (Sample) | 1.2% | 0.81% |
| Standard Deviation (Population) | 1.2% | 0.81% |
Similar Demographics by Self-Care Disability
Demographics Similar to Mongolians by Self-Care Disability
In terms of self-care disability, the demographic groups most similar to Mongolians are Swedish (2.3%, a difference of 0.010%), Brazilian (2.3%, a difference of 0.070%), Egyptian (2.3%, a difference of 0.090%), Immigrants from Argentina (2.3%, a difference of 0.10%), and South African (2.3%, a difference of 0.13%).
| Demographics | Rating | Rank | Self-Care Disability |
| Immigrants | Eastern Asia | 99.6 /100 | #56 | Exceptional 2.3% |
| Immigrants | Belgium | 99.6 /100 | #57 | Exceptional 2.3% |
| Immigrants | Cameroon | 99.6 /100 | #58 | Exceptional 2.3% |
| New Zealanders | 99.5 /100 | #59 | Exceptional 2.3% |
| Immigrants | Japan | 99.5 /100 | #60 | Exceptional 2.3% |
| Palestinians | 99.4 /100 | #61 | Exceptional 2.3% |
| Egyptians | 99.4 /100 | #62 | Exceptional 2.3% |
| Mongolians | 99.3 /100 | #63 | Exceptional 2.3% |
| Swedes | 99.3 /100 | #64 | Exceptional 2.3% |
| Brazilians | 99.3 /100 | #65 | Exceptional 2.3% |
| Immigrants | Argentina | 99.3 /100 | #66 | Exceptional 2.3% |
| South Africans | 99.3 /100 | #67 | Exceptional 2.3% |
| Immigrants | Zaire | 99.2 /100 | #68 | Exceptional 2.3% |
| Immigrants | Norway | 99.2 /100 | #69 | Exceptional 2.3% |
| Immigrants | Northern Europe | 99.2 /100 | #70 | Exceptional 2.3% |
Demographics Similar to Iraqis by Self-Care Disability
In terms of self-care disability, the demographic groups most similar to Iraqis are Chinese (2.6%, a difference of 0.10%), Osage (2.6%, a difference of 0.16%), Immigrants from Philippines (2.6%, a difference of 0.18%), Guatemalan (2.6%, a difference of 0.19%), and Spaniard (2.6%, a difference of 0.22%).
| Demographics | Rating | Rank | Self-Care Disability |
| Scotch-Irish | 4.1 /100 | #218 | Tragic 2.6% |
| Immigrants | Moldova | 4.0 /100 | #219 | Tragic 2.6% |
| Sub-Saharan Africans | 4.0 /100 | #220 | Tragic 2.6% |
| Hondurans | 3.8 /100 | #221 | Tragic 2.6% |
| Spaniards | 3.8 /100 | #222 | Tragic 2.6% |
| French Canadians | 3.8 /100 | #223 | Tragic 2.6% |
| Osage | 3.6 /100 | #224 | Tragic 2.6% |
| Iraqis | 3.2 /100 | #225 | Tragic 2.6% |
| Chinese | 2.9 /100 | #226 | Tragic 2.6% |
| Immigrants | Philippines | 2.7 /100 | #227 | Tragic 2.6% |
| Guatemalans | 2.7 /100 | #228 | Tragic 2.6% |
| Guamanians/Chamorros | 2.5 /100 | #229 | Tragic 2.6% |
| Immigrants | Ecuador | 2.5 /100 | #230 | Tragic 2.6% |
| Immigrants | Guatemala | 2.2 /100 | #231 | Tragic 2.6% |
| Albanians | 2.2 /100 | #232 | Tragic 2.6% |