Somali vs Immigrants from Netherlands Median Male Earnings
COMPARE
Somali
Immigrants from Netherlands
Median Male Earnings
Median Male Earnings Comparison
Somalis
Immigrants from Netherlands
$49,025
MEDIAN MALE EARNINGS
0.5/ 100
METRIC RATING
266th/ 347
METRIC RANK
$61,096
MEDIAN MALE EARNINGS
99.8/ 100
METRIC RATING
59th/ 347
METRIC RANK
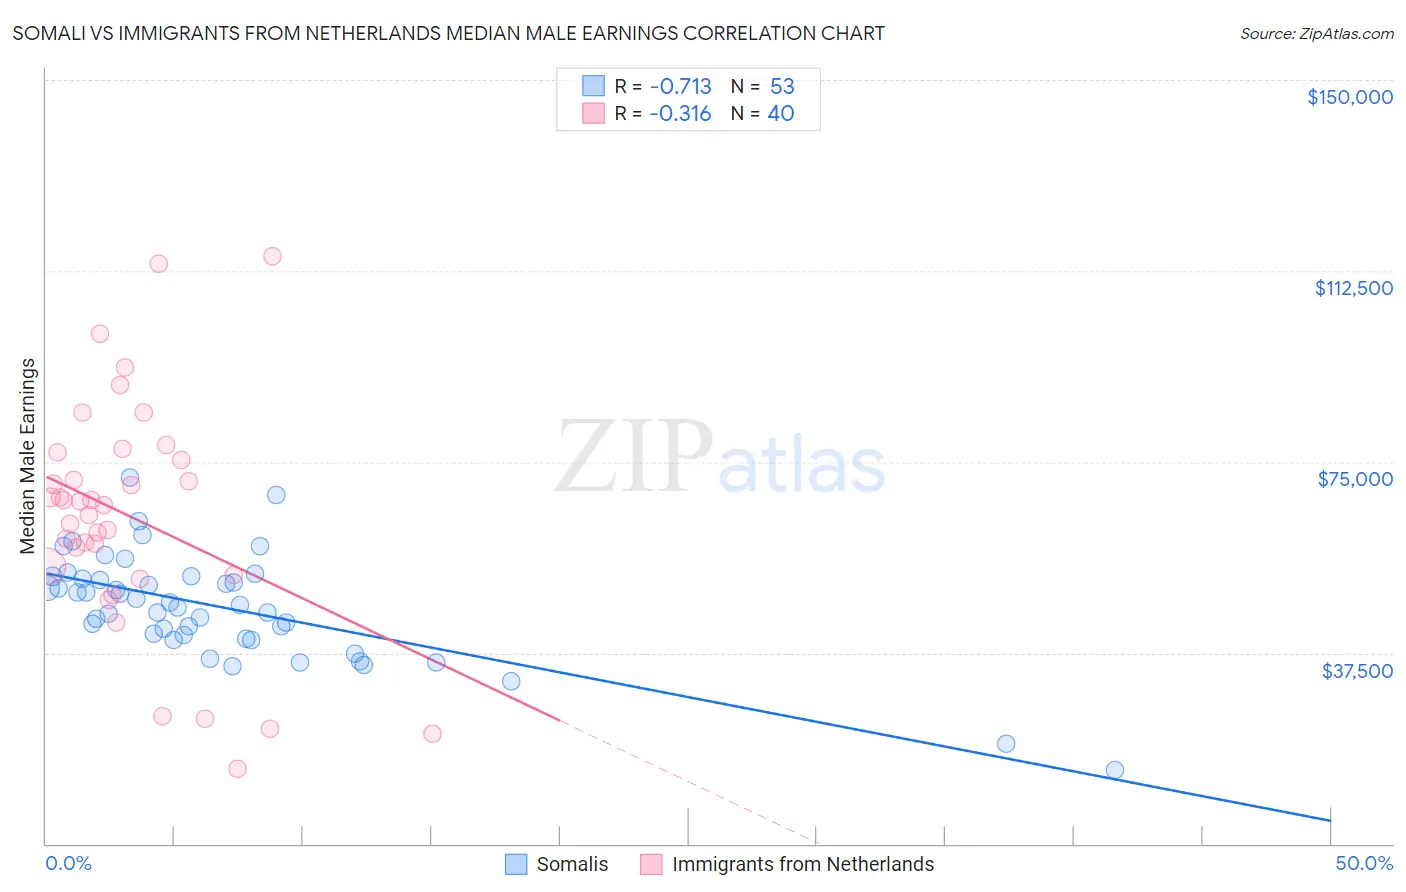
Somali vs Immigrants from Netherlands Median Male Earnings Correlation Chart
The statistical analysis conducted on geographies consisting of 99,323,068 people shows a strong negative correlation between the proportion of Somalis and median male earnings in the United States with a correlation coefficient (R) of -0.713 and weighted average of $49,025. Similarly, the statistical analysis conducted on geographies consisting of 237,827,633 people shows a mild negative correlation between the proportion of Immigrants from Netherlands and median male earnings in the United States with a correlation coefficient (R) of -0.316 and weighted average of $61,096, a difference of 24.6%.
Median Male Earnings Correlation Summary
| Measurement | Somali | Immigrants from Netherlands |
| Minimum | $14,382 | $14,643 |
| Maximum | $71,947 | $115,494 |
| Range | $57,565 | $100,851 |
| Mean | $46,539 | $64,341 |
| Median | $46,803 | $66,907 |
| Interquartile 25% (IQ1) | $40,598 | $53,639 |
| Interquartile 75% (IQ3) | $52,221 | $76,092 |
| Interquartile Range (IQR) | $11,623 | $22,453 |
| Standard Deviation (Sample) | $10,412 | $22,767 |
| Standard Deviation (Population) | $10,313 | $22,481 |
Similar Demographics by Median Male Earnings
Demographics Similar to Somalis by Median Male Earnings
In terms of median male earnings, the demographic groups most similar to Somalis are Spanish American ($49,008, a difference of 0.040%), Ute ($48,899, a difference of 0.26%), Immigrants from Laos ($49,190, a difference of 0.34%), Immigrants from Middle Africa ($49,201, a difference of 0.36%), and Nicaraguan ($49,215, a difference of 0.39%).
| Demographics | Rating | Rank | Median Male Earnings |
| Nepalese | 0.7 /100 | #259 | Tragic $49,458 |
| Iroquois | 0.7 /100 | #260 | Tragic $49,374 |
| Liberians | 0.6 /100 | #261 | Tragic $49,318 |
| Immigrants | West Indies | 0.6 /100 | #262 | Tragic $49,271 |
| Nicaraguans | 0.6 /100 | #263 | Tragic $49,215 |
| Immigrants | Middle Africa | 0.6 /100 | #264 | Tragic $49,201 |
| Immigrants | Laos | 0.6 /100 | #265 | Tragic $49,190 |
| Somalis | 0.5 /100 | #266 | Tragic $49,025 |
| Spanish Americans | 0.5 /100 | #267 | Tragic $49,008 |
| Ute | 0.4 /100 | #268 | Tragic $48,899 |
| Tsimshian | 0.4 /100 | #269 | Tragic $48,836 |
| Potawatomi | 0.4 /100 | #270 | Tragic $48,768 |
| Cherokee | 0.3 /100 | #271 | Tragic $48,669 |
| Salvadorans | 0.3 /100 | #272 | Tragic $48,646 |
| Jamaicans | 0.3 /100 | #273 | Tragic $48,632 |
Demographics Similar to Immigrants from Netherlands by Median Male Earnings
In terms of median male earnings, the demographic groups most similar to Immigrants from Netherlands are Egyptian ($61,095, a difference of 0.0%), Bolivian ($61,066, a difference of 0.050%), Immigrants from Romania ($61,040, a difference of 0.090%), New Zealander ($61,199, a difference of 0.17%), and Immigrants from Pakistan ($60,987, a difference of 0.18%).
| Demographics | Rating | Rank | Median Male Earnings |
| Immigrants | Norway | 99.9 /100 | #52 | Exceptional $61,628 |
| South Africans | 99.9 /100 | #53 | Exceptional $61,460 |
| Immigrants | Latvia | 99.9 /100 | #54 | Exceptional $61,422 |
| Greeks | 99.9 /100 | #55 | Exceptional $61,242 |
| Lithuanians | 99.9 /100 | #56 | Exceptional $61,228 |
| Immigrants | Scotland | 99.9 /100 | #57 | Exceptional $61,220 |
| New Zealanders | 99.9 /100 | #58 | Exceptional $61,199 |
| Immigrants | Netherlands | 99.8 /100 | #59 | Exceptional $61,096 |
| Egyptians | 99.8 /100 | #60 | Exceptional $61,095 |
| Bolivians | 99.8 /100 | #61 | Exceptional $61,066 |
| Immigrants | Romania | 99.8 /100 | #62 | Exceptional $61,040 |
| Immigrants | Pakistan | 99.8 /100 | #63 | Exceptional $60,987 |
| Immigrants | Eastern Europe | 99.8 /100 | #64 | Exceptional $60,958 |
| Immigrants | Indonesia | 99.8 /100 | #65 | Exceptional $60,935 |
| Immigrants | Croatia | 99.8 /100 | #66 | Exceptional $60,914 |