Bolivian vs Immigrants from Netherlands Disability Age 5 to 17
COMPARE
Bolivian
Immigrants from Netherlands
Disability Age 5 to 17
Disability Age 5 to 17 Comparison
Bolivians
Immigrants from Netherlands
5.0%
DISABILITY AGE 5 TO 17
100.0/ 100
METRIC RATING
35th/ 347
METRIC RANK
5.4%
DISABILITY AGE 5 TO 17
90.5/ 100
METRIC RATING
140th/ 347
METRIC RANK
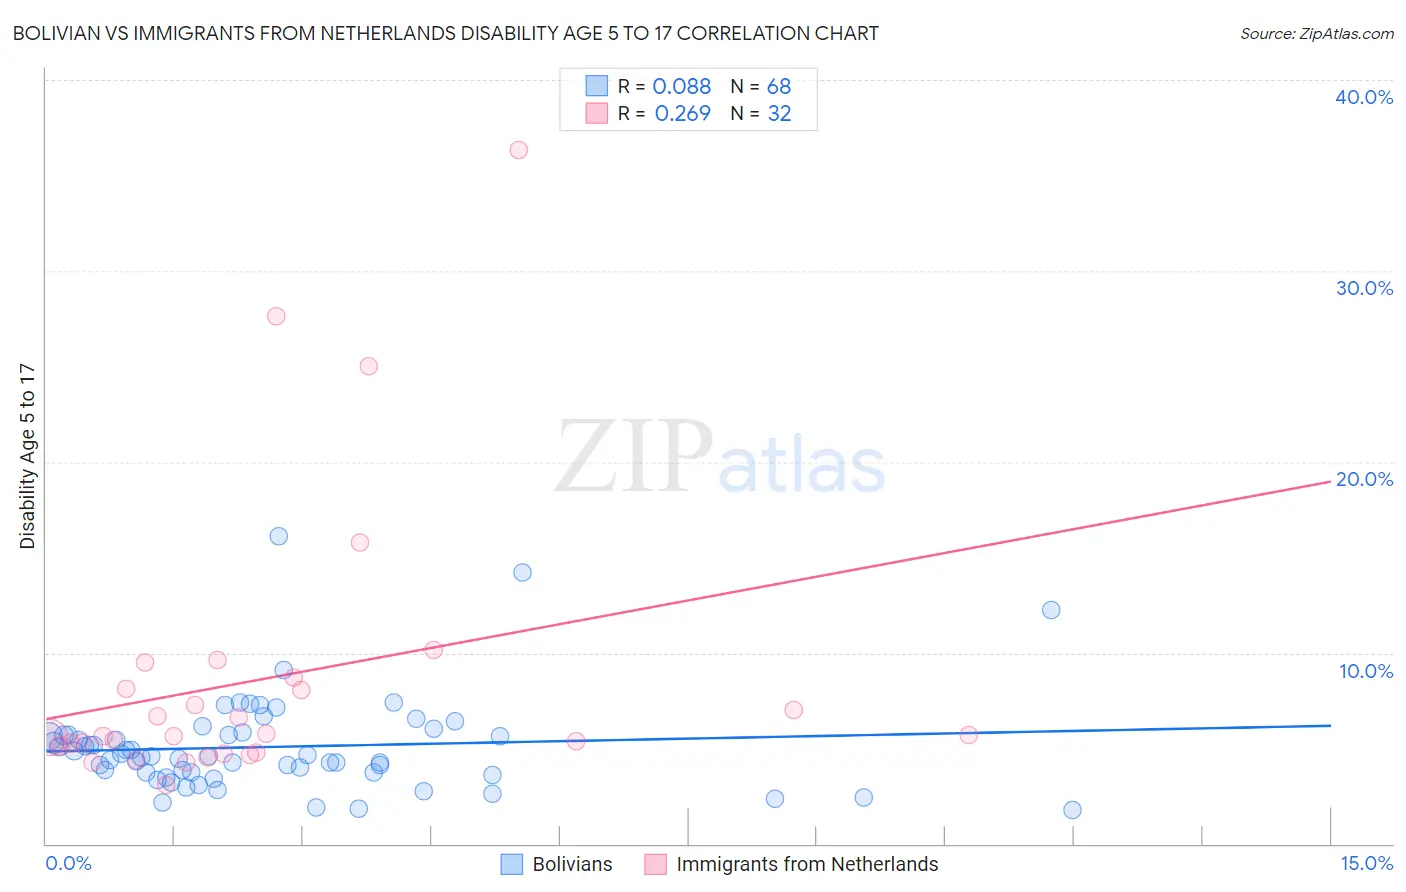
Bolivian vs Immigrants from Netherlands Disability Age 5 to 17 Correlation Chart
The statistical analysis conducted on geographies consisting of 184,162,509 people shows a slight positive correlation between the proportion of Bolivians and percentage of population with a disability between the ages 5 and 17 in the United States with a correlation coefficient (R) of 0.088 and weighted average of 5.0%. Similarly, the statistical analysis conducted on geographies consisting of 236,298,961 people shows a weak positive correlation between the proportion of Immigrants from Netherlands and percentage of population with a disability between the ages 5 and 17 in the United States with a correlation coefficient (R) of 0.269 and weighted average of 5.4%, a difference of 8.8%.
Disability Age 5 to 17 Correlation Summary
| Measurement | Bolivian | Immigrants from Netherlands |
| Minimum | 1.8% | 3.1% |
| Maximum | 16.1% | 36.4% |
| Range | 14.4% | 33.3% |
| Mean | 5.1% | 8.6% |
| Median | 4.6% | 5.7% |
| Interquartile 25% (IQ1) | 3.7% | 5.0% |
| Interquartile 75% (IQ3) | 5.7% | 8.4% |
| Interquartile Range (IQR) | 1.9% | 3.5% |
| Standard Deviation (Sample) | 2.5% | 7.4% |
| Standard Deviation (Population) | 2.5% | 7.3% |
Similar Demographics by Disability Age 5 to 17
Demographics Similar to Bolivians by Disability Age 5 to 17
In terms of disability age 5 to 17, the demographic groups most similar to Bolivians are Immigrants from Egypt (5.0%, a difference of 0.050%), Immigrants from Belarus (5.0%, a difference of 0.070%), Immigrants from Philippines (5.0%, a difference of 0.11%), Immigrants from Argentina (5.0%, a difference of 0.12%), and Israeli (5.0%, a difference of 0.19%).
| Demographics | Rating | Rank | Disability Age 5 to 17 |
| Immigrants | Japan | 100.0 /100 | #28 | Exceptional 4.9% |
| Immigrants | Serbia | 100.0 /100 | #29 | Exceptional 4.9% |
| Immigrants | Malaysia | 100.0 /100 | #30 | Exceptional 5.0% |
| Immigrants | Pakistan | 100.0 /100 | #31 | Exceptional 5.0% |
| Soviet Union | 100.0 /100 | #32 | Exceptional 5.0% |
| Immigrants | Indonesia | 100.0 /100 | #33 | Exceptional 5.0% |
| Israelis | 100.0 /100 | #34 | Exceptional 5.0% |
| Bolivians | 100.0 /100 | #35 | Exceptional 5.0% |
| Immigrants | Egypt | 100.0 /100 | #36 | Exceptional 5.0% |
| Immigrants | Belarus | 100.0 /100 | #37 | Exceptional 5.0% |
| Immigrants | Philippines | 100.0 /100 | #38 | Exceptional 5.0% |
| Immigrants | Argentina | 100.0 /100 | #39 | Exceptional 5.0% |
| Okinawans | 100.0 /100 | #40 | Exceptional 5.0% |
| Immigrants | Australia | 100.0 /100 | #41 | Exceptional 5.0% |
| Immigrants | Sri Lanka | 100.0 /100 | #42 | Exceptional 5.0% |
Demographics Similar to Immigrants from Netherlands by Disability Age 5 to 17
In terms of disability age 5 to 17, the demographic groups most similar to Immigrants from Netherlands are Immigrants from Oceania (5.4%, a difference of 0.050%), Belizean (5.4%, a difference of 0.050%), Navajo (5.4%, a difference of 0.060%), Immigrants from Denmark (5.4%, a difference of 0.14%), and South American Indian (5.5%, a difference of 0.17%).
| Demographics | Rating | Rank | Disability Age 5 to 17 |
| Venezuelans | 92.7 /100 | #133 | Exceptional 5.4% |
| Yuman | 92.3 /100 | #134 | Exceptional 5.4% |
| Immigrants | Belize | 91.7 /100 | #135 | Exceptional 5.4% |
| Immigrants | Denmark | 91.4 /100 | #136 | Exceptional 5.4% |
| Navajo | 90.9 /100 | #137 | Exceptional 5.4% |
| Immigrants | Oceania | 90.8 /100 | #138 | Exceptional 5.4% |
| Belizeans | 90.8 /100 | #139 | Exceptional 5.4% |
| Immigrants | Netherlands | 90.5 /100 | #140 | Exceptional 5.4% |
| South American Indians | 89.3 /100 | #141 | Excellent 5.5% |
| Colombians | 88.0 /100 | #142 | Excellent 5.5% |
| Immigrants | Hungary | 87.9 /100 | #143 | Excellent 5.5% |
| Pakistanis | 87.3 /100 | #144 | Excellent 5.5% |
| Immigrants | Guatemala | 86.6 /100 | #145 | Excellent 5.5% |
| Albanians | 83.7 /100 | #146 | Excellent 5.5% |
| Immigrants | Albania | 83.1 /100 | #147 | Excellent 5.5% |