Slovak vs Immigrants from Ghana Female Disability
COMPARE
Slovak
Immigrants from Ghana
Female Disability
Female Disability Comparison
Slovaks
Immigrants from Ghana
13.3%
FEMALE DISABILITY
0.0/ 100
METRIC RATING
297th/ 347
METRIC RANK
12.2%
FEMALE DISABILITY
42.5/ 100
METRIC RATING
177th/ 347
METRIC RANK
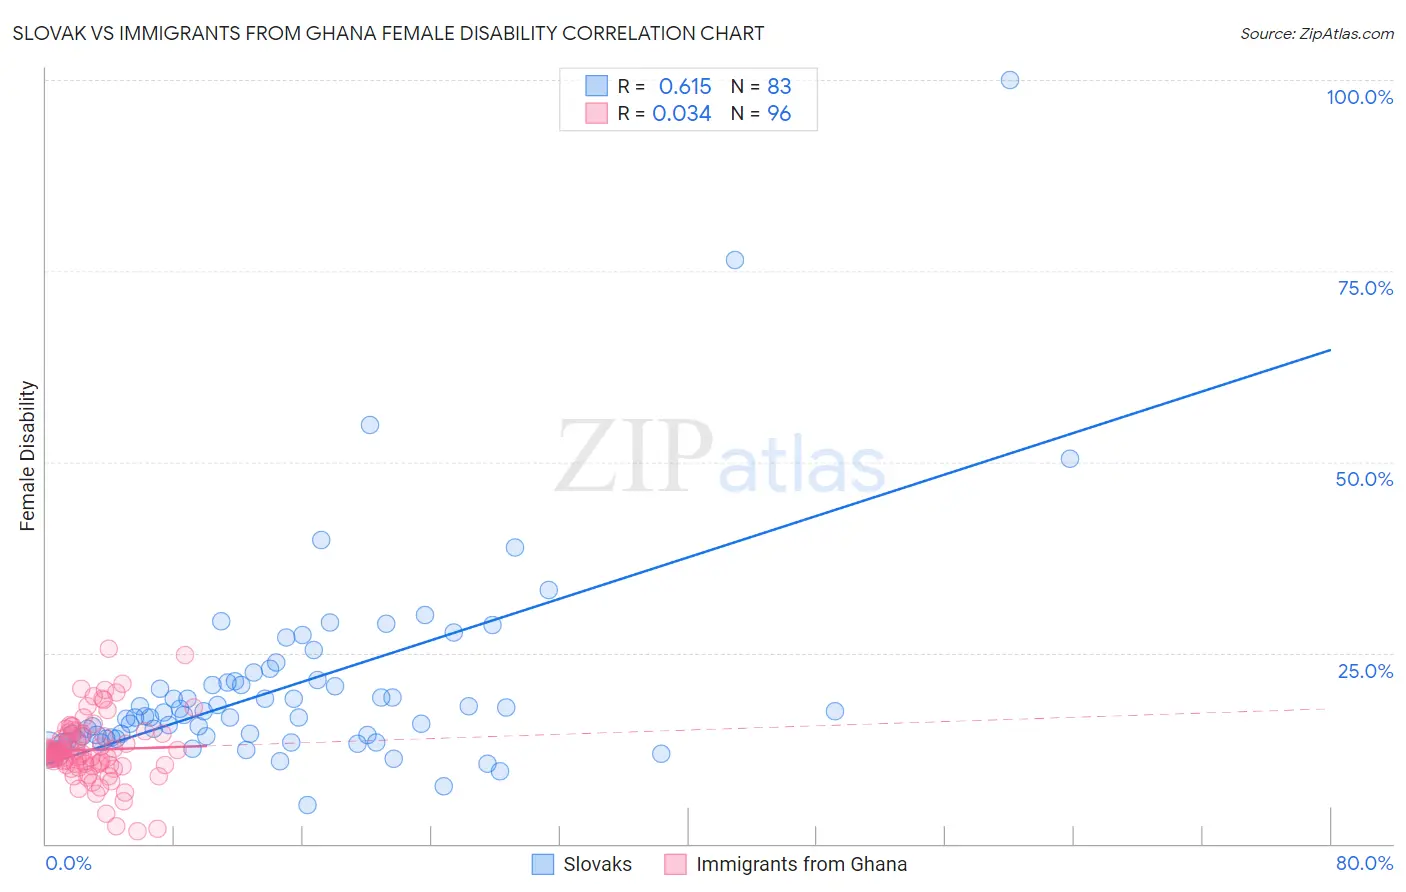
Slovak vs Immigrants from Ghana Female Disability Correlation Chart
The statistical analysis conducted on geographies consisting of 397,843,321 people shows a significant positive correlation between the proportion of Slovaks and percentage of females with a disability in the United States with a correlation coefficient (R) of 0.615 and weighted average of 13.3%. Similarly, the statistical analysis conducted on geographies consisting of 199,930,167 people shows no correlation between the proportion of Immigrants from Ghana and percentage of females with a disability in the United States with a correlation coefficient (R) of 0.034 and weighted average of 12.2%, a difference of 9.0%.
Female Disability Correlation Summary
| Measurement | Slovak | Immigrants from Ghana |
| Minimum | 5.0% | 1.6% |
| Maximum | 100.0% | 25.6% |
| Range | 95.0% | 24.0% |
| Mean | 20.5% | 12.3% |
| Median | 16.6% | 12.0% |
| Interquartile 25% (IQ1) | 13.8% | 10.4% |
| Interquartile 75% (IQ3) | 21.3% | 14.3% |
| Interquartile Range (IQR) | 7.5% | 3.9% |
| Standard Deviation (Sample) | 13.7% | 4.2% |
| Standard Deviation (Population) | 13.6% | 4.1% |
Similar Demographics by Female Disability
Demographics Similar to Slovaks by Female Disability
In terms of female disability, the demographic groups most similar to Slovaks are Nepalese (13.3%, a difference of 0.030%), French (13.3%, a difference of 0.17%), Nonimmigrants (13.4%, a difference of 0.30%), Celtic (13.3%, a difference of 0.38%), and Marshallese (13.3%, a difference of 0.42%).
| Demographics | Rating | Rank | Female Disability |
| Immigrants | Yemen | 0.0 /100 | #290 | Tragic 13.2% |
| Shoshone | 0.0 /100 | #291 | Tragic 13.2% |
| Yakama | 0.0 /100 | #292 | Tragic 13.2% |
| Marshallese | 0.0 /100 | #293 | Tragic 13.3% |
| Celtics | 0.0 /100 | #294 | Tragic 13.3% |
| French | 0.0 /100 | #295 | Tragic 13.3% |
| Nepalese | 0.0 /100 | #296 | Tragic 13.3% |
| Slovaks | 0.0 /100 | #297 | Tragic 13.3% |
| Immigrants | Nonimmigrants | 0.0 /100 | #298 | Tragic 13.4% |
| Immigrants | Dominican Republic | 0.0 /100 | #299 | Tragic 13.4% |
| Pennsylvania Germans | 0.0 /100 | #300 | Tragic 13.4% |
| Africans | 0.0 /100 | #301 | Tragic 13.4% |
| Scotch-Irish | 0.0 /100 | #302 | Tragic 13.4% |
| Immigrants | Portugal | 0.0 /100 | #303 | Tragic 13.5% |
| Immigrants | Micronesia | 0.0 /100 | #304 | Tragic 13.5% |
Demographics Similar to Immigrants from Ghana by Female Disability
In terms of female disability, the demographic groups most similar to Immigrants from Ghana are Immigrants from Guyana (12.2%, a difference of 0.030%), Immigrants from Western Europe (12.2%, a difference of 0.060%), Immigrants from Fiji (12.3%, a difference of 0.17%), Albanian (12.3%, a difference of 0.18%), and Immigrants from Canada (12.3%, a difference of 0.21%).
| Demographics | Rating | Rank | Female Disability |
| Maltese | 57.0 /100 | #170 | Average 12.2% |
| Immigrants | Southern Europe | 56.3 /100 | #171 | Average 12.2% |
| Haitians | 51.9 /100 | #172 | Average 12.2% |
| Immigrants | Mexico | 50.8 /100 | #173 | Average 12.2% |
| Immigrants | England | 50.0 /100 | #174 | Average 12.2% |
| Immigrants | St. Vincent and the Grenadines | 49.7 /100 | #175 | Average 12.2% |
| Immigrants | Guyana | 43.1 /100 | #176 | Average 12.2% |
| Immigrants | Ghana | 42.5 /100 | #177 | Average 12.2% |
| Immigrants | Western Europe | 40.9 /100 | #178 | Average 12.2% |
| Immigrants | Fiji | 38.2 /100 | #179 | Fair 12.3% |
| Albanians | 37.9 /100 | #180 | Fair 12.3% |
| Immigrants | Canada | 37.2 /100 | #181 | Fair 12.3% |
| Norwegians | 36.9 /100 | #182 | Fair 12.3% |
| Cubans | 36.5 /100 | #183 | Fair 12.3% |
| Iraqis | 36.0 /100 | #184 | Fair 12.3% |