Slovak vs Immigrants from Afghanistan Female Disability
COMPARE
Slovak
Immigrants from Afghanistan
Female Disability
Female Disability Comparison
Slovaks
Immigrants from Afghanistan
13.3%
FEMALE DISABILITY
0.0/ 100
METRIC RATING
297th/ 347
METRIC RANK
11.5%
FEMALE DISABILITY
99.7/ 100
METRIC RATING
77th/ 347
METRIC RANK
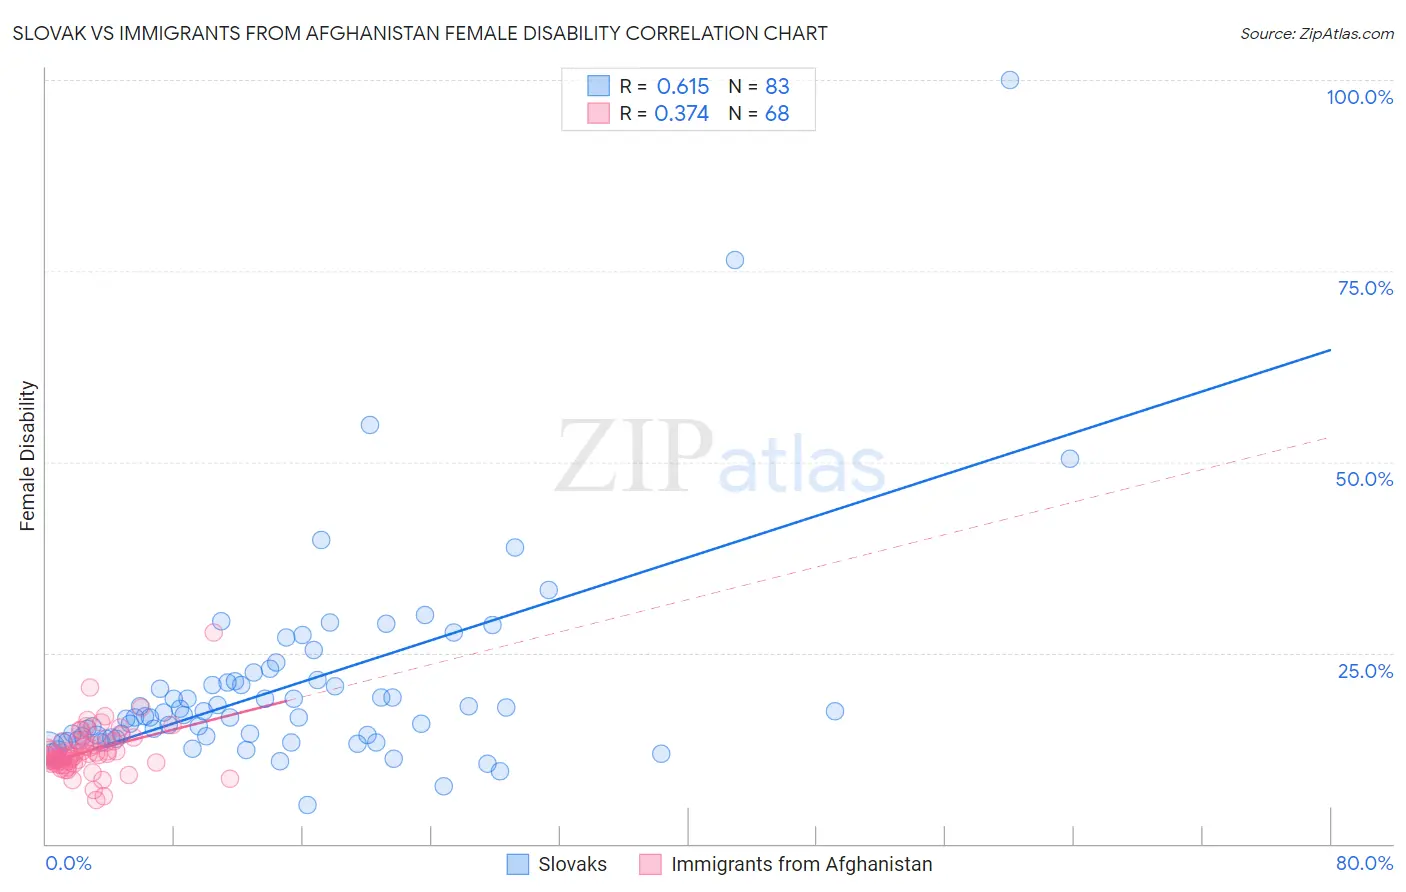
Slovak vs Immigrants from Afghanistan Female Disability Correlation Chart
The statistical analysis conducted on geographies consisting of 397,843,321 people shows a significant positive correlation between the proportion of Slovaks and percentage of females with a disability in the United States with a correlation coefficient (R) of 0.615 and weighted average of 13.3%. Similarly, the statistical analysis conducted on geographies consisting of 147,644,439 people shows a mild positive correlation between the proportion of Immigrants from Afghanistan and percentage of females with a disability in the United States with a correlation coefficient (R) of 0.374 and weighted average of 11.5%, a difference of 15.7%.
Female Disability Correlation Summary
| Measurement | Slovak | Immigrants from Afghanistan |
| Minimum | 5.0% | 5.7% |
| Maximum | 100.0% | 27.6% |
| Range | 95.0% | 21.9% |
| Mean | 20.5% | 12.1% |
| Median | 16.6% | 11.6% |
| Interquartile 25% (IQ1) | 13.8% | 10.6% |
| Interquartile 75% (IQ3) | 21.3% | 13.3% |
| Interquartile Range (IQR) | 7.5% | 2.7% |
| Standard Deviation (Sample) | 13.7% | 3.2% |
| Standard Deviation (Population) | 13.6% | 3.2% |
Similar Demographics by Female Disability
Demographics Similar to Slovaks by Female Disability
In terms of female disability, the demographic groups most similar to Slovaks are Nepalese (13.3%, a difference of 0.030%), French (13.3%, a difference of 0.17%), Nonimmigrants (13.4%, a difference of 0.30%), Celtic (13.3%, a difference of 0.38%), and Marshallese (13.3%, a difference of 0.42%).
| Demographics | Rating | Rank | Female Disability |
| Immigrants | Yemen | 0.0 /100 | #290 | Tragic 13.2% |
| Shoshone | 0.0 /100 | #291 | Tragic 13.2% |
| Yakama | 0.0 /100 | #292 | Tragic 13.2% |
| Marshallese | 0.0 /100 | #293 | Tragic 13.3% |
| Celtics | 0.0 /100 | #294 | Tragic 13.3% |
| French | 0.0 /100 | #295 | Tragic 13.3% |
| Nepalese | 0.0 /100 | #296 | Tragic 13.3% |
| Slovaks | 0.0 /100 | #297 | Tragic 13.3% |
| Immigrants | Nonimmigrants | 0.0 /100 | #298 | Tragic 13.4% |
| Immigrants | Dominican Republic | 0.0 /100 | #299 | Tragic 13.4% |
| Pennsylvania Germans | 0.0 /100 | #300 | Tragic 13.4% |
| Africans | 0.0 /100 | #301 | Tragic 13.4% |
| Scotch-Irish | 0.0 /100 | #302 | Tragic 13.4% |
| Immigrants | Portugal | 0.0 /100 | #303 | Tragic 13.5% |
| Immigrants | Micronesia | 0.0 /100 | #304 | Tragic 13.5% |
Demographics Similar to Immigrants from Afghanistan by Female Disability
In terms of female disability, the demographic groups most similar to Immigrants from Afghanistan are Immigrants from Eritrea (11.5%, a difference of 0.0%), Immigrants from South Africa (11.5%, a difference of 0.010%), Immigrants from Lebanon (11.5%, a difference of 0.030%), Sierra Leonean (11.5%, a difference of 0.030%), and Immigrants from Jordan (11.5%, a difference of 0.040%).
| Demographics | Rating | Rank | Female Disability |
| Immigrants | Chile | 99.8 /100 | #70 | Exceptional 11.5% |
| Immigrants | Ireland | 99.8 /100 | #71 | Exceptional 11.5% |
| Chileans | 99.8 /100 | #72 | Exceptional 11.5% |
| Immigrants | Switzerland | 99.8 /100 | #73 | Exceptional 11.5% |
| Bhutanese | 99.8 /100 | #74 | Exceptional 11.5% |
| Immigrants | Lebanon | 99.7 /100 | #75 | Exceptional 11.5% |
| Immigrants | Eritrea | 99.7 /100 | #76 | Exceptional 11.5% |
| Immigrants | Afghanistan | 99.7 /100 | #77 | Exceptional 11.5% |
| Immigrants | South Africa | 99.7 /100 | #78 | Exceptional 11.5% |
| Sierra Leoneans | 99.7 /100 | #79 | Exceptional 11.5% |
| Immigrants | Jordan | 99.7 /100 | #80 | Exceptional 11.5% |
| Eastern Europeans | 99.7 /100 | #81 | Exceptional 11.5% |
| Luxembourgers | 99.6 /100 | #82 | Exceptional 11.6% |
| Immigrants | Serbia | 99.6 /100 | #83 | Exceptional 11.6% |
| Immigrants | Poland | 99.6 /100 | #84 | Exceptional 11.6% |