Slovak vs Immigrants from Ghana Median Male Earnings
COMPARE
Slovak
Immigrants from Ghana
Median Male Earnings
Median Male Earnings Comparison
Slovaks
Immigrants from Ghana
$56,306
MEDIAN MALE EARNINGS
85.5/ 100
METRIC RATING
138th/ 347
METRIC RANK
$51,836
MEDIAN MALE EARNINGS
6.9/ 100
METRIC RATING
219th/ 347
METRIC RANK
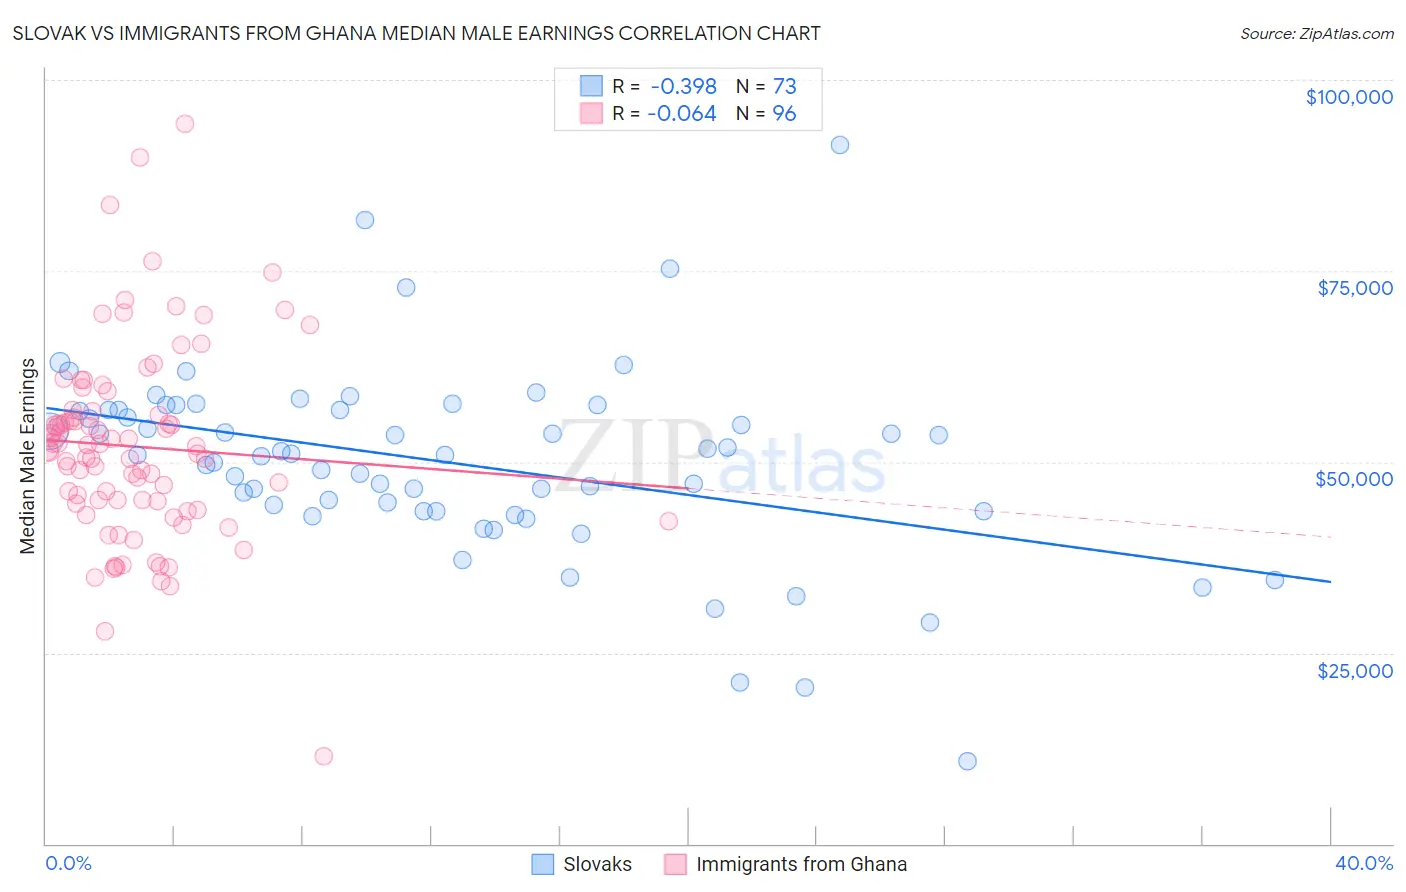
Slovak vs Immigrants from Ghana Median Male Earnings Correlation Chart
The statistical analysis conducted on geographies consisting of 397,698,254 people shows a mild negative correlation between the proportion of Slovaks and median male earnings in the United States with a correlation coefficient (R) of -0.398 and weighted average of $56,306. Similarly, the statistical analysis conducted on geographies consisting of 199,928,244 people shows a slight negative correlation between the proportion of Immigrants from Ghana and median male earnings in the United States with a correlation coefficient (R) of -0.064 and weighted average of $51,836, a difference of 8.6%.
Median Male Earnings Correlation Summary
| Measurement | Slovak | Immigrants from Ghana |
| Minimum | $10,727 | $11,405 |
| Maximum | $91,563 | $94,205 |
| Range | $80,836 | $82,800 |
| Mean | $49,965 | $52,017 |
| Median | $50,933 | $51,835 |
| Interquartile 25% (IQ1) | $43,560 | $44,651 |
| Interquartile 75% (IQ3) | $56,815 | $56,389 |
| Interquartile Range (IQR) | $13,254 | $11,739 |
| Standard Deviation (Sample) | $12,608 | $12,685 |
| Standard Deviation (Population) | $12,522 | $12,619 |
Similar Demographics by Median Male Earnings
Demographics Similar to Slovaks by Median Male Earnings
In terms of median male earnings, the demographic groups most similar to Slovaks are Zimbabwean ($56,302, a difference of 0.010%), Luxembourger ($56,300, a difference of 0.010%), Danish ($56,246, a difference of 0.11%), Ethiopian ($56,243, a difference of 0.11%), and Slavic ($56,390, a difference of 0.15%).
| Demographics | Rating | Rank | Median Male Earnings |
| Portuguese | 89.4 /100 | #131 | Excellent $56,663 |
| Czechs | 88.2 /100 | #132 | Excellent $56,546 |
| Immigrants | Germany | 88.2 /100 | #133 | Excellent $56,542 |
| Moroccans | 87.7 /100 | #134 | Excellent $56,499 |
| Irish | 87.4 /100 | #135 | Excellent $56,464 |
| Immigrants | Saudi Arabia | 87.2 /100 | #136 | Excellent $56,452 |
| Slavs | 86.5 /100 | #137 | Excellent $56,390 |
| Slovaks | 85.5 /100 | #138 | Excellent $56,306 |
| Zimbabweans | 85.5 /100 | #139 | Excellent $56,302 |
| Luxembourgers | 85.5 /100 | #140 | Excellent $56,300 |
| Danes | 84.8 /100 | #141 | Excellent $56,246 |
| Ethiopians | 84.8 /100 | #142 | Excellent $56,243 |
| Sri Lankans | 83.4 /100 | #143 | Excellent $56,136 |
| Immigrants | Uganda | 82.4 /100 | #144 | Excellent $56,064 |
| Norwegians | 80.9 /100 | #145 | Excellent $55,965 |
Demographics Similar to Immigrants from Ghana by Median Male Earnings
In terms of median male earnings, the demographic groups most similar to Immigrants from Ghana are Immigrants from Armenia ($51,793, a difference of 0.080%), Immigrants from Panama ($51,962, a difference of 0.24%), Immigrants from Senegal ($51,647, a difference of 0.37%), Immigrants from Bangladesh ($51,642, a difference of 0.38%), and Nigerian ($52,039, a difference of 0.39%).
| Demographics | Rating | Rank | Median Male Earnings |
| Cajuns | 10.7 /100 | #212 | Poor $52,325 |
| Native Hawaiians | 10.5 /100 | #213 | Poor $52,306 |
| Immigrants | Nonimmigrants | 9.3 /100 | #214 | Tragic $52,170 |
| Immigrants | Cameroon | 8.9 /100 | #215 | Tragic $52,119 |
| Immigrants | Venezuela | 8.3 /100 | #216 | Tragic $52,041 |
| Nigerians | 8.3 /100 | #217 | Tragic $52,039 |
| Immigrants | Panama | 7.7 /100 | #218 | Tragic $51,962 |
| Immigrants | Ghana | 6.9 /100 | #219 | Tragic $51,836 |
| Immigrants | Armenia | 6.6 /100 | #220 | Tragic $51,793 |
| Immigrants | Senegal | 5.8 /100 | #221 | Tragic $51,647 |
| Immigrants | Bangladesh | 5.8 /100 | #222 | Tragic $51,642 |
| Ecuadorians | 5.5 /100 | #223 | Tragic $51,596 |
| Immigrants | Cambodia | 5.5 /100 | #224 | Tragic $51,594 |
| Immigrants | Sudan | 5.0 /100 | #225 | Tragic $51,489 |
| Japanese | 4.9 /100 | #226 | Tragic $51,473 |