Immigrants from Iraq vs Immigrants from Ghana Female Disability
COMPARE
Immigrants from Iraq
Immigrants from Ghana
Female Disability
Female Disability Comparison
Immigrants from Iraq
Immigrants from Ghana
12.5%
FEMALE DISABILITY
5.3/ 100
METRIC RATING
233rd/ 347
METRIC RANK
12.2%
FEMALE DISABILITY
42.5/ 100
METRIC RATING
177th/ 347
METRIC RANK
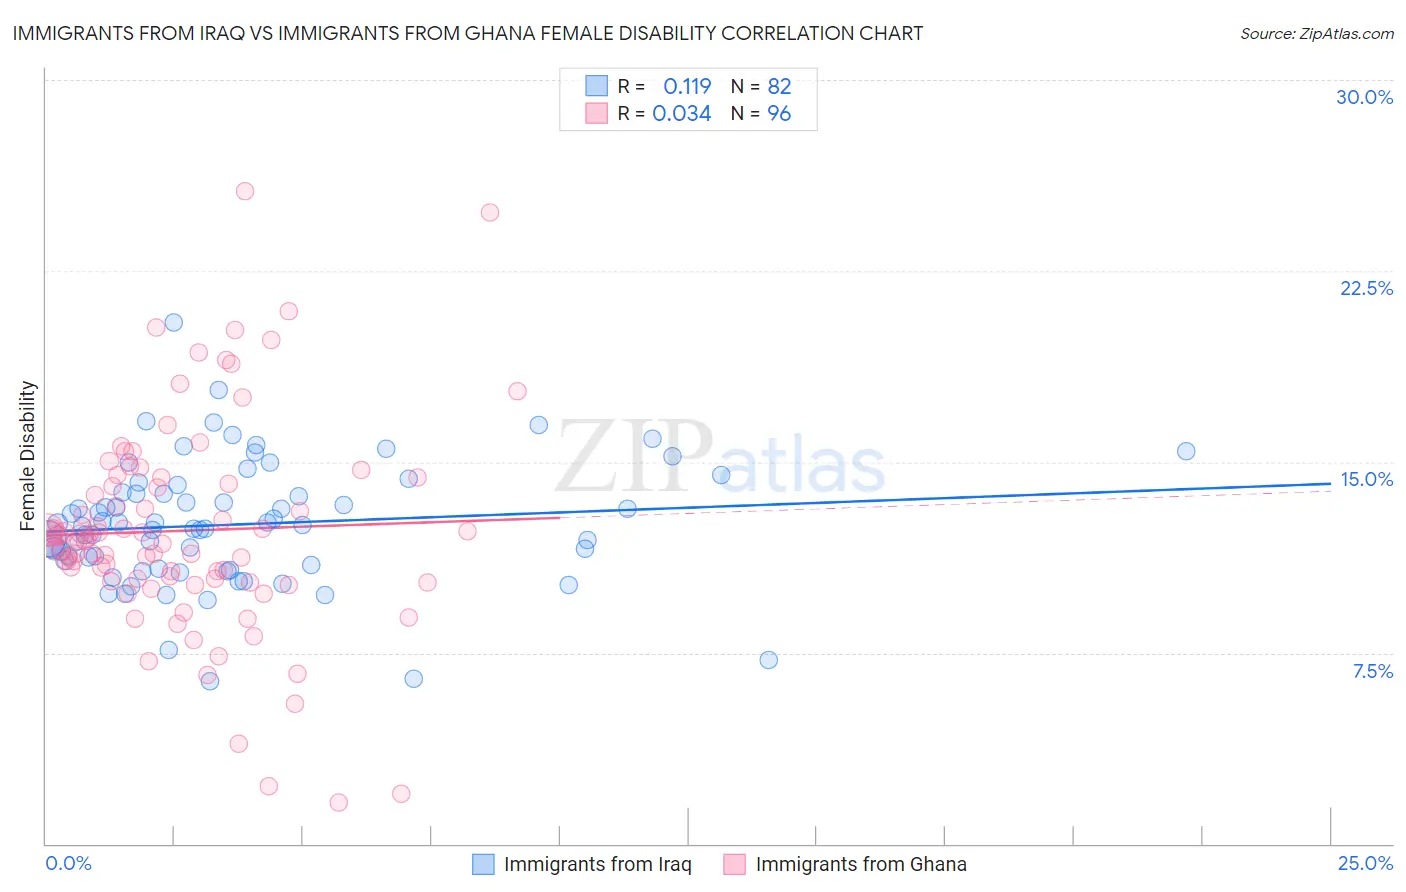
Immigrants from Iraq vs Immigrants from Ghana Female Disability Correlation Chart
The statistical analysis conducted on geographies consisting of 194,760,840 people shows a poor positive correlation between the proportion of Immigrants from Iraq and percentage of females with a disability in the United States with a correlation coefficient (R) of 0.119 and weighted average of 12.5%. Similarly, the statistical analysis conducted on geographies consisting of 199,930,167 people shows no correlation between the proportion of Immigrants from Ghana and percentage of females with a disability in the United States with a correlation coefficient (R) of 0.034 and weighted average of 12.2%, a difference of 2.4%.
Female Disability Correlation Summary
| Measurement | Immigrants from Iraq | Immigrants from Ghana |
| Minimum | 6.4% | 1.6% |
| Maximum | 20.5% | 25.6% |
| Range | 14.1% | 24.0% |
| Mean | 12.5% | 12.3% |
| Median | 12.5% | 12.0% |
| Interquartile 25% (IQ1) | 10.9% | 10.4% |
| Interquartile 75% (IQ3) | 13.8% | 14.3% |
| Interquartile Range (IQR) | 2.9% | 3.9% |
| Standard Deviation (Sample) | 2.4% | 4.2% |
| Standard Deviation (Population) | 2.4% | 4.1% |
Similar Demographics by Female Disability
Demographics Similar to Immigrants from Iraq by Female Disability
In terms of female disability, the demographic groups most similar to Immigrants from Iraq are Scandinavian (12.5%, a difference of 0.010%), Malaysian (12.5%, a difference of 0.060%), Immigrants from Somalia (12.5%, a difference of 0.10%), Belgian (12.5%, a difference of 0.19%), and Immigrants from West Indies (12.6%, a difference of 0.19%).
| Demographics | Rating | Rank | Female Disability |
| Hispanics or Latinos | 8.0 /100 | #226 | Tragic 12.5% |
| Assyrians/Chaldeans/Syriacs | 8.0 /100 | #227 | Tragic 12.5% |
| Immigrants | Cambodia | 7.8 /100 | #228 | Tragic 12.5% |
| Hungarians | 7.2 /100 | #229 | Tragic 12.5% |
| Immigrants | Belize | 7.0 /100 | #230 | Tragic 12.5% |
| Belgians | 6.5 /100 | #231 | Tragic 12.5% |
| Immigrants | Somalia | 5.9 /100 | #232 | Tragic 12.5% |
| Immigrants | Iraq | 5.3 /100 | #233 | Tragic 12.5% |
| Scandinavians | 5.3 /100 | #234 | Tragic 12.5% |
| Malaysians | 5.0 /100 | #235 | Tragic 12.5% |
| Immigrants | West Indies | 4.4 /100 | #236 | Tragic 12.6% |
| Slavs | 3.8 /100 | #237 | Tragic 12.6% |
| Yugoslavians | 3.7 /100 | #238 | Tragic 12.6% |
| Barbadians | 3.6 /100 | #239 | Tragic 12.6% |
| German Russians | 3.2 /100 | #240 | Tragic 12.6% |
Demographics Similar to Immigrants from Ghana by Female Disability
In terms of female disability, the demographic groups most similar to Immigrants from Ghana are Immigrants from Guyana (12.2%, a difference of 0.030%), Immigrants from Western Europe (12.2%, a difference of 0.060%), Immigrants from Fiji (12.3%, a difference of 0.17%), Albanian (12.3%, a difference of 0.18%), and Immigrants from Canada (12.3%, a difference of 0.21%).
| Demographics | Rating | Rank | Female Disability |
| Maltese | 57.0 /100 | #170 | Average 12.2% |
| Immigrants | Southern Europe | 56.3 /100 | #171 | Average 12.2% |
| Haitians | 51.9 /100 | #172 | Average 12.2% |
| Immigrants | Mexico | 50.8 /100 | #173 | Average 12.2% |
| Immigrants | England | 50.0 /100 | #174 | Average 12.2% |
| Immigrants | St. Vincent and the Grenadines | 49.7 /100 | #175 | Average 12.2% |
| Immigrants | Guyana | 43.1 /100 | #176 | Average 12.2% |
| Immigrants | Ghana | 42.5 /100 | #177 | Average 12.2% |
| Immigrants | Western Europe | 40.9 /100 | #178 | Average 12.2% |
| Immigrants | Fiji | 38.2 /100 | #179 | Fair 12.3% |
| Albanians | 37.9 /100 | #180 | Fair 12.3% |
| Immigrants | Canada | 37.2 /100 | #181 | Fair 12.3% |
| Norwegians | 36.9 /100 | #182 | Fair 12.3% |
| Cubans | 36.5 /100 | #183 | Fair 12.3% |
| Iraqis | 36.0 /100 | #184 | Fair 12.3% |