Somali vs Immigrants from Ghana Female Disability
COMPARE
Somali
Immigrants from Ghana
Female Disability
Female Disability Comparison
Somalis
Immigrants from Ghana
12.3%
FEMALE DISABILITY
21.5/ 100
METRIC RATING
202nd/ 347
METRIC RANK
12.2%
FEMALE DISABILITY
42.5/ 100
METRIC RATING
177th/ 347
METRIC RANK
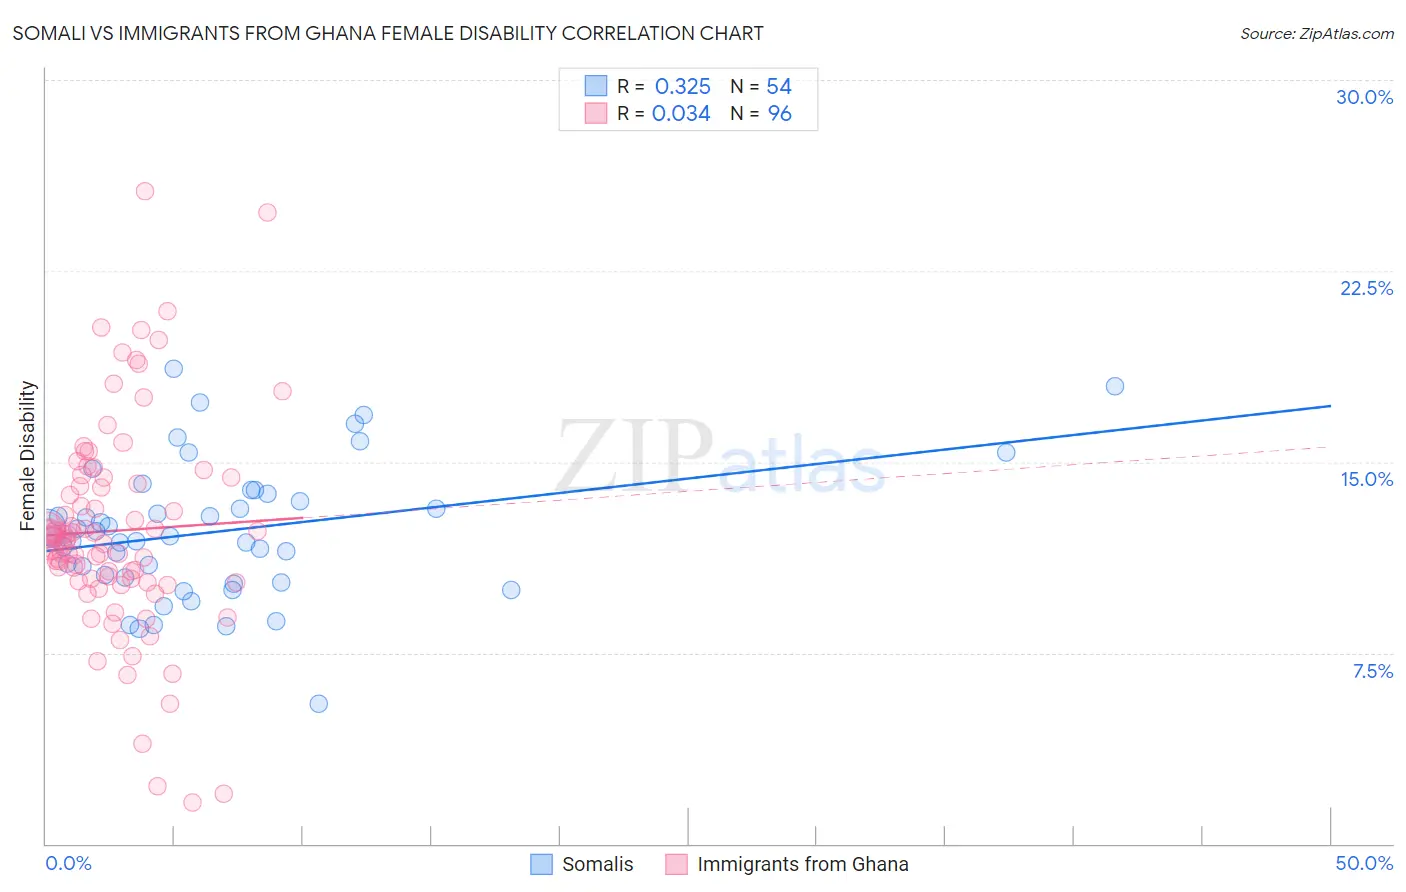
Somali vs Immigrants from Ghana Female Disability Correlation Chart
The statistical analysis conducted on geographies consisting of 99,314,959 people shows a mild positive correlation between the proportion of Somalis and percentage of females with a disability in the United States with a correlation coefficient (R) of 0.325 and weighted average of 12.3%. Similarly, the statistical analysis conducted on geographies consisting of 199,930,167 people shows no correlation between the proportion of Immigrants from Ghana and percentage of females with a disability in the United States with a correlation coefficient (R) of 0.034 and weighted average of 12.2%, a difference of 0.93%.
Female Disability Correlation Summary
| Measurement | Somali | Immigrants from Ghana |
| Minimum | 5.5% | 1.6% |
| Maximum | 18.6% | 25.6% |
| Range | 13.1% | 24.0% |
| Mean | 12.3% | 12.3% |
| Median | 12.1% | 12.0% |
| Interquartile 25% (IQ1) | 10.5% | 10.4% |
| Interquartile 75% (IQ3) | 13.7% | 14.3% |
| Interquartile Range (IQR) | 3.3% | 3.9% |
| Standard Deviation (Sample) | 2.7% | 4.2% |
| Standard Deviation (Population) | 2.6% | 4.1% |
Similar Demographics by Female Disability
Demographics Similar to Somalis by Female Disability
In terms of female disability, the demographic groups most similar to Somalis are Immigrants from Barbados (12.3%, a difference of 0.020%), Chinese (12.3%, a difference of 0.030%), Trinidadian and Tobagonian (12.3%, a difference of 0.040%), Immigrants from Zaire (12.3%, a difference of 0.040%), and Immigrants from Grenada (12.4%, a difference of 0.060%).
| Demographics | Rating | Rank | Female Disability |
| Swedes | 26.6 /100 | #195 | Fair 12.3% |
| Immigrants | Panama | 25.5 /100 | #196 | Fair 12.3% |
| Hondurans | 25.4 /100 | #197 | Fair 12.3% |
| Mexican American Indians | 24.9 /100 | #198 | Fair 12.3% |
| Immigrants | Trinidad and Tobago | 24.7 /100 | #199 | Fair 12.3% |
| Trinidadians and Tobagonians | 22.4 /100 | #200 | Fair 12.3% |
| Chinese | 22.1 /100 | #201 | Fair 12.3% |
| Somalis | 21.5 /100 | #202 | Fair 12.3% |
| Immigrants | Barbados | 21.1 /100 | #203 | Fair 12.3% |
| Immigrants | Zaire | 20.9 /100 | #204 | Fair 12.3% |
| Immigrants | Grenada | 20.5 /100 | #205 | Fair 12.4% |
| Immigrants | Cuba | 20.2 /100 | #206 | Fair 12.4% |
| Croatians | 20.2 /100 | #207 | Fair 12.4% |
| Basques | 17.5 /100 | #208 | Poor 12.4% |
| Mexicans | 15.7 /100 | #209 | Poor 12.4% |
Demographics Similar to Immigrants from Ghana by Female Disability
In terms of female disability, the demographic groups most similar to Immigrants from Ghana are Immigrants from Guyana (12.2%, a difference of 0.030%), Immigrants from Western Europe (12.2%, a difference of 0.060%), Immigrants from Fiji (12.3%, a difference of 0.17%), Albanian (12.3%, a difference of 0.18%), and Immigrants from Canada (12.3%, a difference of 0.21%).
| Demographics | Rating | Rank | Female Disability |
| Maltese | 57.0 /100 | #170 | Average 12.2% |
| Immigrants | Southern Europe | 56.3 /100 | #171 | Average 12.2% |
| Haitians | 51.9 /100 | #172 | Average 12.2% |
| Immigrants | Mexico | 50.8 /100 | #173 | Average 12.2% |
| Immigrants | England | 50.0 /100 | #174 | Average 12.2% |
| Immigrants | St. Vincent and the Grenadines | 49.7 /100 | #175 | Average 12.2% |
| Immigrants | Guyana | 43.1 /100 | #176 | Average 12.2% |
| Immigrants | Ghana | 42.5 /100 | #177 | Average 12.2% |
| Immigrants | Western Europe | 40.9 /100 | #178 | Average 12.2% |
| Immigrants | Fiji | 38.2 /100 | #179 | Fair 12.3% |
| Albanians | 37.9 /100 | #180 | Fair 12.3% |
| Immigrants | Canada | 37.2 /100 | #181 | Fair 12.3% |
| Norwegians | 36.9 /100 | #182 | Fair 12.3% |
| Cubans | 36.5 /100 | #183 | Fair 12.3% |
| Iraqis | 36.0 /100 | #184 | Fair 12.3% |