Slovak vs Nepalese Female Disability
COMPARE
Slovak
Nepalese
Female Disability
Female Disability Comparison
Slovaks
Nepalese
13.3%
FEMALE DISABILITY
0.0/ 100
METRIC RATING
297th/ 347
METRIC RANK
13.3%
FEMALE DISABILITY
0.0/ 100
METRIC RATING
296th/ 347
METRIC RANK
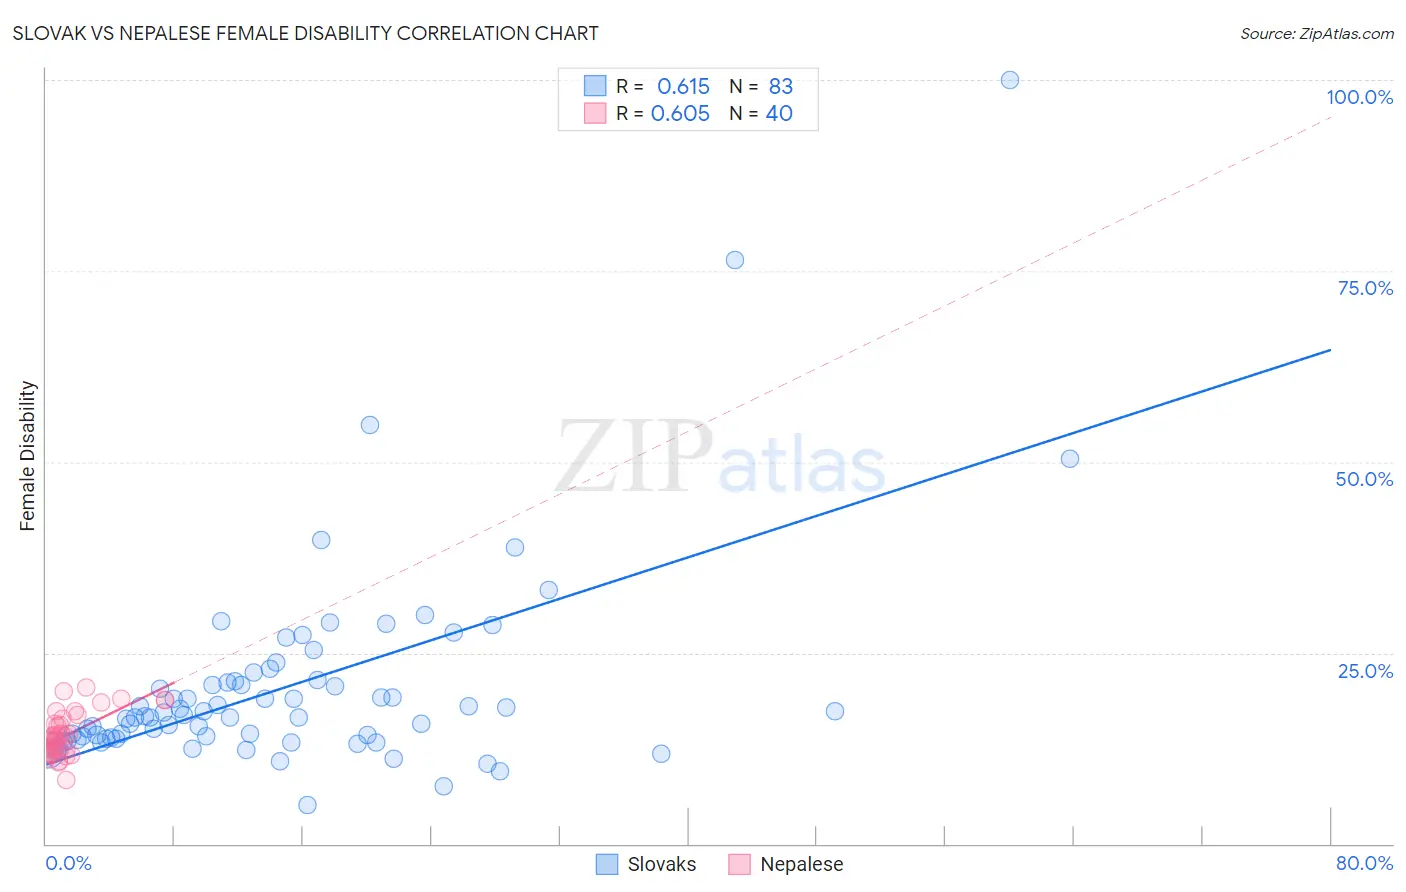
Slovak vs Nepalese Female Disability Correlation Chart
The statistical analysis conducted on geographies consisting of 397,843,321 people shows a significant positive correlation between the proportion of Slovaks and percentage of females with a disability in the United States with a correlation coefficient (R) of 0.615 and weighted average of 13.3%. Similarly, the statistical analysis conducted on geographies consisting of 24,521,755 people shows a significant positive correlation between the proportion of Nepalese and percentage of females with a disability in the United States with a correlation coefficient (R) of 0.605 and weighted average of 13.3%, a difference of 0.030%.
Female Disability Correlation Summary
| Measurement | Slovak | Nepalese |
| Minimum | 5.0% | 8.3% |
| Maximum | 100.0% | 20.5% |
| Range | 95.0% | 12.2% |
| Mean | 20.5% | 14.2% |
| Median | 16.6% | 13.8% |
| Interquartile 25% (IQ1) | 13.8% | 12.0% |
| Interquartile 75% (IQ3) | 21.3% | 16.1% |
| Interquartile Range (IQR) | 7.5% | 4.1% |
| Standard Deviation (Sample) | 13.7% | 2.9% |
| Standard Deviation (Population) | 13.6% | 2.8% |
Demographics Similar to Slovaks and Nepalese by Female Disability
In terms of female disability, the demographic groups most similar to Slovaks are French (13.3%, a difference of 0.17%), Nonimmigrants (13.4%, a difference of 0.30%), Celtic (13.3%, a difference of 0.38%), Marshallese (13.3%, a difference of 0.42%), and Immigrants from Dominican Republic (13.4%, a difference of 0.56%). Similarly, the demographic groups most similar to Nepalese are French (13.3%, a difference of 0.14%), Celtic (13.3%, a difference of 0.34%), Nonimmigrants (13.4%, a difference of 0.34%), Marshallese (13.3%, a difference of 0.39%), and Immigrants from Dominican Republic (13.4%, a difference of 0.59%).
| Demographics | Rating | Rank | Female Disability |
| Fijians | 0.0 /100 | #286 | Tragic 13.1% |
| Yaqui | 0.0 /100 | #287 | Tragic 13.2% |
| Whites/Caucasians | 0.0 /100 | #288 | Tragic 13.2% |
| Tlingit-Haida | 0.0 /100 | #289 | Tragic 13.2% |
| Immigrants | Yemen | 0.0 /100 | #290 | Tragic 13.2% |
| Shoshone | 0.0 /100 | #291 | Tragic 13.2% |
| Yakama | 0.0 /100 | #292 | Tragic 13.2% |
| Marshallese | 0.0 /100 | #293 | Tragic 13.3% |
| Celtics | 0.0 /100 | #294 | Tragic 13.3% |
| French | 0.0 /100 | #295 | Tragic 13.3% |
| Nepalese | 0.0 /100 | #296 | Tragic 13.3% |
| Slovaks | 0.0 /100 | #297 | Tragic 13.3% |
| Immigrants | Nonimmigrants | 0.0 /100 | #298 | Tragic 13.4% |
| Immigrants | Dominican Republic | 0.0 /100 | #299 | Tragic 13.4% |
| Pennsylvania Germans | 0.0 /100 | #300 | Tragic 13.4% |
| Africans | 0.0 /100 | #301 | Tragic 13.4% |
| Scotch-Irish | 0.0 /100 | #302 | Tragic 13.4% |
| Immigrants | Portugal | 0.0 /100 | #303 | Tragic 13.5% |
| Immigrants | Micronesia | 0.0 /100 | #304 | Tragic 13.5% |
| Dominicans | 0.0 /100 | #305 | Tragic 13.5% |
| French Canadians | 0.0 /100 | #306 | Tragic 13.6% |