Slovak vs Immigrants from North America Female Disability
COMPARE
Slovak
Immigrants from North America
Female Disability
Female Disability Comparison
Slovaks
Immigrants from North America
13.3%
FEMALE DISABILITY
0.0/ 100
METRIC RATING
297th/ 347
METRIC RANK
12.3%
FEMALE DISABILITY
32.8/ 100
METRIC RATING
188th/ 347
METRIC RANK
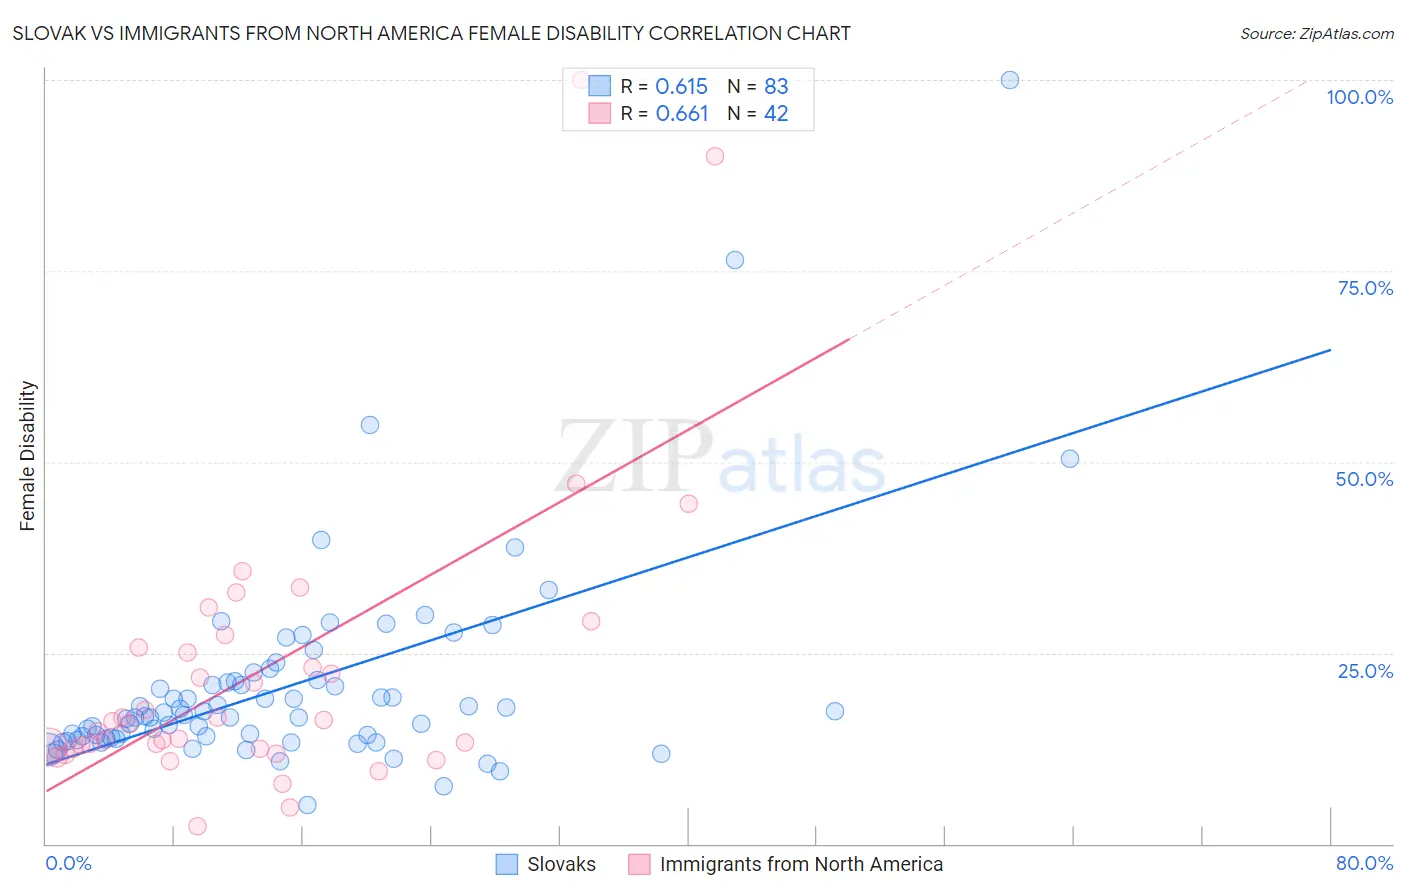
Slovak vs Immigrants from North America Female Disability Correlation Chart
The statistical analysis conducted on geographies consisting of 397,843,321 people shows a significant positive correlation between the proportion of Slovaks and percentage of females with a disability in the United States with a correlation coefficient (R) of 0.615 and weighted average of 13.3%. Similarly, the statistical analysis conducted on geographies consisting of 462,407,592 people shows a significant positive correlation between the proportion of Immigrants from North America and percentage of females with a disability in the United States with a correlation coefficient (R) of 0.661 and weighted average of 12.3%, a difference of 8.6%.
Female Disability Correlation Summary
| Measurement | Slovak | Immigrants from North America |
| Minimum | 5.0% | 2.3% |
| Maximum | 100.0% | 100.0% |
| Range | 95.0% | 97.7% |
| Mean | 20.5% | 22.3% |
| Median | 16.6% | 15.9% |
| Interquartile 25% (IQ1) | 13.8% | 12.5% |
| Interquartile 75% (IQ3) | 21.3% | 25.7% |
| Interquartile Range (IQR) | 7.5% | 13.2% |
| Standard Deviation (Sample) | 13.7% | 19.2% |
| Standard Deviation (Population) | 13.6% | 19.0% |
Similar Demographics by Female Disability
Demographics Similar to Slovaks by Female Disability
In terms of female disability, the demographic groups most similar to Slovaks are Nepalese (13.3%, a difference of 0.030%), French (13.3%, a difference of 0.17%), Nonimmigrants (13.4%, a difference of 0.30%), Celtic (13.3%, a difference of 0.38%), and Marshallese (13.3%, a difference of 0.42%).
| Demographics | Rating | Rank | Female Disability |
| Immigrants | Yemen | 0.0 /100 | #290 | Tragic 13.2% |
| Shoshone | 0.0 /100 | #291 | Tragic 13.2% |
| Yakama | 0.0 /100 | #292 | Tragic 13.2% |
| Marshallese | 0.0 /100 | #293 | Tragic 13.3% |
| Celtics | 0.0 /100 | #294 | Tragic 13.3% |
| French | 0.0 /100 | #295 | Tragic 13.3% |
| Nepalese | 0.0 /100 | #296 | Tragic 13.3% |
| Slovaks | 0.0 /100 | #297 | Tragic 13.3% |
| Immigrants | Nonimmigrants | 0.0 /100 | #298 | Tragic 13.4% |
| Immigrants | Dominican Republic | 0.0 /100 | #299 | Tragic 13.4% |
| Pennsylvania Germans | 0.0 /100 | #300 | Tragic 13.4% |
| Africans | 0.0 /100 | #301 | Tragic 13.4% |
| Scotch-Irish | 0.0 /100 | #302 | Tragic 13.4% |
| Immigrants | Portugal | 0.0 /100 | #303 | Tragic 13.5% |
| Immigrants | Micronesia | 0.0 /100 | #304 | Tragic 13.5% |
Demographics Similar to Immigrants from North America by Female Disability
In terms of female disability, the demographic groups most similar to Immigrants from North America are Serbian (12.3%, a difference of 0.010%), Austrian (12.3%, a difference of 0.020%), Immigrants from Uzbekistan (12.3%, a difference of 0.050%), Immigrants from Albania (12.3%, a difference of 0.050%), and Immigrants from Honduras (12.3%, a difference of 0.060%).
| Demographics | Rating | Rank | Female Disability |
| Immigrants | Canada | 37.2 /100 | #181 | Fair 12.3% |
| Norwegians | 36.9 /100 | #182 | Fair 12.3% |
| Cubans | 36.5 /100 | #183 | Fair 12.3% |
| Iraqis | 36.0 /100 | #184 | Fair 12.3% |
| Immigrants | Uzbekistan | 33.9 /100 | #185 | Fair 12.3% |
| Austrians | 33.3 /100 | #186 | Fair 12.3% |
| Serbians | 33.1 /100 | #187 | Fair 12.3% |
| Immigrants | North America | 32.8 /100 | #188 | Fair 12.3% |
| Immigrants | Albania | 31.6 /100 | #189 | Fair 12.3% |
| Immigrants | Honduras | 31.3 /100 | #190 | Fair 12.3% |
| Armenians | 29.7 /100 | #191 | Fair 12.3% |
| Immigrants | Western Africa | 29.2 /100 | #192 | Fair 12.3% |
| Northern Europeans | 27.5 /100 | #193 | Fair 12.3% |
| Ukrainians | 27.2 /100 | #194 | Fair 12.3% |
| Swedes | 26.6 /100 | #195 | Fair 12.3% |