Slovak vs Indonesian Female Disability
COMPARE
Slovak
Indonesian
Female Disability
Female Disability Comparison
Slovaks
Indonesians
13.3%
FEMALE DISABILITY
0.0/ 100
METRIC RATING
297th/ 347
METRIC RANK
12.8%
FEMALE DISABILITY
0.4/ 100
METRIC RATING
269th/ 347
METRIC RANK
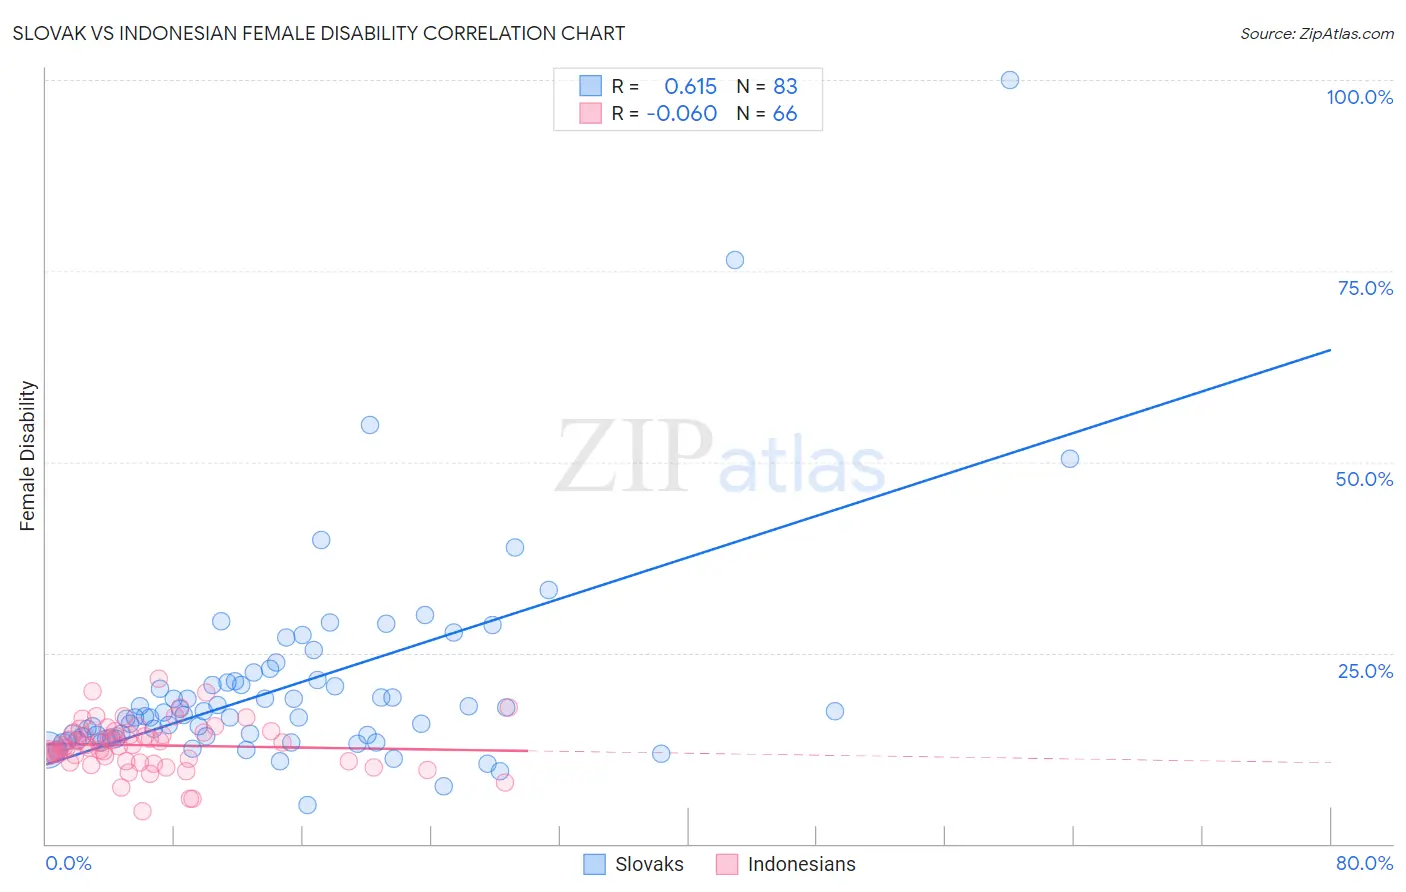
Slovak vs Indonesian Female Disability Correlation Chart
The statistical analysis conducted on geographies consisting of 397,843,321 people shows a significant positive correlation between the proportion of Slovaks and percentage of females with a disability in the United States with a correlation coefficient (R) of 0.615 and weighted average of 13.3%. Similarly, the statistical analysis conducted on geographies consisting of 162,725,263 people shows a slight negative correlation between the proportion of Indonesians and percentage of females with a disability in the United States with a correlation coefficient (R) of -0.060 and weighted average of 12.8%, a difference of 3.9%.
Female Disability Correlation Summary
| Measurement | Slovak | Indonesian |
| Minimum | 5.0% | 4.3% |
| Maximum | 100.0% | 21.6% |
| Range | 95.0% | 17.3% |
| Mean | 20.5% | 12.9% |
| Median | 16.6% | 12.9% |
| Interquartile 25% (IQ1) | 13.8% | 10.9% |
| Interquartile 75% (IQ3) | 21.3% | 14.6% |
| Interquartile Range (IQR) | 7.5% | 3.7% |
| Standard Deviation (Sample) | 13.7% | 3.2% |
| Standard Deviation (Population) | 13.6% | 3.2% |
Similar Demographics by Female Disability
Demographics Similar to Slovaks by Female Disability
In terms of female disability, the demographic groups most similar to Slovaks are Nepalese (13.3%, a difference of 0.030%), French (13.3%, a difference of 0.17%), Nonimmigrants (13.4%, a difference of 0.30%), Celtic (13.3%, a difference of 0.38%), and Marshallese (13.3%, a difference of 0.42%).
| Demographics | Rating | Rank | Female Disability |
| Immigrants | Yemen | 0.0 /100 | #290 | Tragic 13.2% |
| Shoshone | 0.0 /100 | #291 | Tragic 13.2% |
| Yakama | 0.0 /100 | #292 | Tragic 13.2% |
| Marshallese | 0.0 /100 | #293 | Tragic 13.3% |
| Celtics | 0.0 /100 | #294 | Tragic 13.3% |
| French | 0.0 /100 | #295 | Tragic 13.3% |
| Nepalese | 0.0 /100 | #296 | Tragic 13.3% |
| Slovaks | 0.0 /100 | #297 | Tragic 13.3% |
| Immigrants | Nonimmigrants | 0.0 /100 | #298 | Tragic 13.4% |
| Immigrants | Dominican Republic | 0.0 /100 | #299 | Tragic 13.4% |
| Pennsylvania Germans | 0.0 /100 | #300 | Tragic 13.4% |
| Africans | 0.0 /100 | #301 | Tragic 13.4% |
| Scotch-Irish | 0.0 /100 | #302 | Tragic 13.4% |
| Immigrants | Portugal | 0.0 /100 | #303 | Tragic 13.5% |
| Immigrants | Micronesia | 0.0 /100 | #304 | Tragic 13.5% |
Demographics Similar to Indonesians by Female Disability
In terms of female disability, the demographic groups most similar to Indonesians are Immigrants from Laos (12.8%, a difference of 0.060%), Senegalese (12.8%, a difference of 0.090%), Finnish (12.8%, a difference of 0.10%), Immigrants from Liberia (12.9%, a difference of 0.18%), and West Indian (12.8%, a difference of 0.22%).
| Demographics | Rating | Rank | Female Disability |
| Czechoslovakians | 0.9 /100 | #262 | Tragic 12.7% |
| Spaniards | 0.7 /100 | #263 | Tragic 12.8% |
| Alaska Natives | 0.6 /100 | #264 | Tragic 12.8% |
| West Indians | 0.5 /100 | #265 | Tragic 12.8% |
| Finns | 0.4 /100 | #266 | Tragic 12.8% |
| Senegalese | 0.4 /100 | #267 | Tragic 12.8% |
| Immigrants | Laos | 0.4 /100 | #268 | Tragic 12.8% |
| Indonesians | 0.4 /100 | #269 | Tragic 12.8% |
| Immigrants | Liberia | 0.3 /100 | #270 | Tragic 12.9% |
| Dutch | 0.2 /100 | #271 | Tragic 12.9% |
| Germans | 0.1 /100 | #272 | Tragic 12.9% |
| Sioux | 0.1 /100 | #273 | Tragic 12.9% |
| Portuguese | 0.1 /100 | #274 | Tragic 13.0% |
| Cheyenne | 0.1 /100 | #275 | Tragic 13.0% |
| Immigrants | Dominica | 0.1 /100 | #276 | Tragic 13.0% |