Slavic vs Immigrants from Iran Disability
COMPARE
Slavic
Immigrants from Iran
Disability
Disability Comparison
Slavs
Immigrants from Iran
12.4%
DISABILITY
0.5/ 100
METRIC RATING
258th/ 347
METRIC RANK
10.3%
DISABILITY
100.0/ 100
METRIC RATING
17th/ 347
METRIC RANK
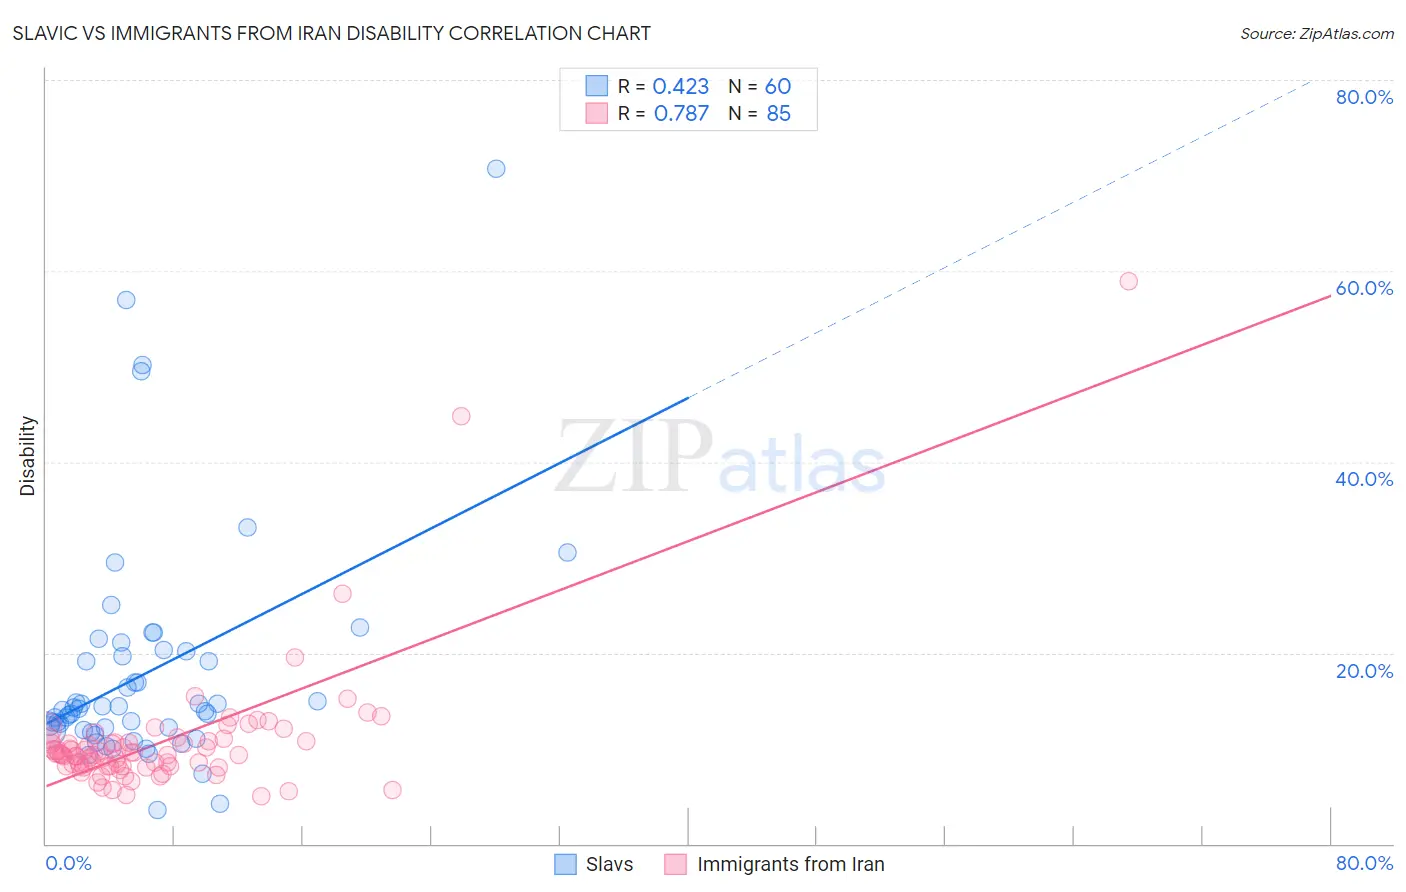
Slavic vs Immigrants from Iran Disability Correlation Chart
The statistical analysis conducted on geographies consisting of 270,861,742 people shows a moderate positive correlation between the proportion of Slavs and percentage of population with a disability in the United States with a correlation coefficient (R) of 0.423 and weighted average of 12.4%. Similarly, the statistical analysis conducted on geographies consisting of 279,897,593 people shows a strong positive correlation between the proportion of Immigrants from Iran and percentage of population with a disability in the United States with a correlation coefficient (R) of 0.787 and weighted average of 10.3%, a difference of 20.7%.
Disability Correlation Summary
| Measurement | Slavic | Immigrants from Iran |
| Minimum | 3.5% | 5.0% |
| Maximum | 70.6% | 58.9% |
| Range | 67.1% | 53.8% |
| Mean | 17.8% | 10.7% |
| Median | 14.0% | 9.3% |
| Interquartile 25% (IQ1) | 11.9% | 8.1% |
| Interquartile 75% (IQ3) | 19.9% | 10.7% |
| Interquartile Range (IQR) | 7.9% | 2.6% |
| Standard Deviation (Sample) | 12.1% | 7.2% |
| Standard Deviation (Population) | 12.0% | 7.1% |
Similar Demographics by Disability
Demographics Similar to Slavs by Disability
In terms of disability, the demographic groups most similar to Slavs are Canadian (12.4%, a difference of 0.060%), Immigrants from Liberia (12.4%, a difference of 0.090%), Immigrants from Laos (12.4%, a difference of 0.14%), Scandinavian (12.4%, a difference of 0.16%), and Immigrants from Dominica (12.4%, a difference of 0.23%).
| Demographics | Rating | Rank | Disability |
| Europeans | 1.4 /100 | #251 | Tragic 12.3% |
| Bermudans | 1.1 /100 | #252 | Tragic 12.3% |
| Belgians | 0.8 /100 | #253 | Tragic 12.3% |
| German Russians | 0.8 /100 | #254 | Tragic 12.3% |
| Slovenes | 0.6 /100 | #255 | Tragic 12.4% |
| Immigrants | Dominica | 0.6 /100 | #256 | Tragic 12.4% |
| Immigrants | Laos | 0.5 /100 | #257 | Tragic 12.4% |
| Slavs | 0.5 /100 | #258 | Tragic 12.4% |
| Canadians | 0.4 /100 | #259 | Tragic 12.4% |
| Immigrants | Liberia | 0.4 /100 | #260 | Tragic 12.4% |
| Scandinavians | 0.4 /100 | #261 | Tragic 12.4% |
| Native Hawaiians | 0.3 /100 | #262 | Tragic 12.5% |
| Hawaiians | 0.2 /100 | #263 | Tragic 12.5% |
| Immigrants | Germany | 0.2 /100 | #264 | Tragic 12.5% |
| U.S. Virgin Islanders | 0.2 /100 | #265 | Tragic 12.5% |
Demographics Similar to Immigrants from Iran by Disability
In terms of disability, the demographic groups most similar to Immigrants from Iran are Indian (Asian) (10.3%, a difference of 0.070%), Okinawan (10.3%, a difference of 0.13%), Immigrants from Korea (10.2%, a difference of 0.44%), Burmese (10.4%, a difference of 0.99%), and Immigrants from Pakistan (10.4%, a difference of 0.99%).
| Demographics | Rating | Rank | Disability |
| Immigrants | China | 100.0 /100 | #10 | Exceptional 10.1% |
| Iranians | 100.0 /100 | #11 | Exceptional 10.1% |
| Immigrants | Israel | 100.0 /100 | #12 | Exceptional 10.1% |
| Immigrants | Eastern Asia | 100.0 /100 | #13 | Exceptional 10.2% |
| Immigrants | Korea | 100.0 /100 | #14 | Exceptional 10.2% |
| Okinawans | 100.0 /100 | #15 | Exceptional 10.3% |
| Indians (Asian) | 100.0 /100 | #16 | Exceptional 10.3% |
| Immigrants | Iran | 100.0 /100 | #17 | Exceptional 10.3% |
| Burmese | 100.0 /100 | #18 | Exceptional 10.4% |
| Immigrants | Pakistan | 100.0 /100 | #19 | Exceptional 10.4% |
| Immigrants | Venezuela | 100.0 /100 | #20 | Exceptional 10.4% |
| Asians | 100.0 /100 | #21 | Exceptional 10.4% |
| Immigrants | Sri Lanka | 100.0 /100 | #22 | Exceptional 10.5% |
| Immigrants | Asia | 100.0 /100 | #23 | Exceptional 10.5% |
| Venezuelans | 100.0 /100 | #24 | Exceptional 10.5% |