Slavic vs Immigrants from Iran Wage/Income Gap
COMPARE
Slavic
Immigrants from Iran
Wage/Income Gap
Wage/Income Gap Comparison
Slavs
Immigrants from Iran
27.4%
WAGE/INCOME GAP
1.8/ 100
METRIC RATING
258th/ 347
METRIC RANK
29.1%
WAGE/INCOME GAP
0.0/ 100
METRIC RATING
327th/ 347
METRIC RANK
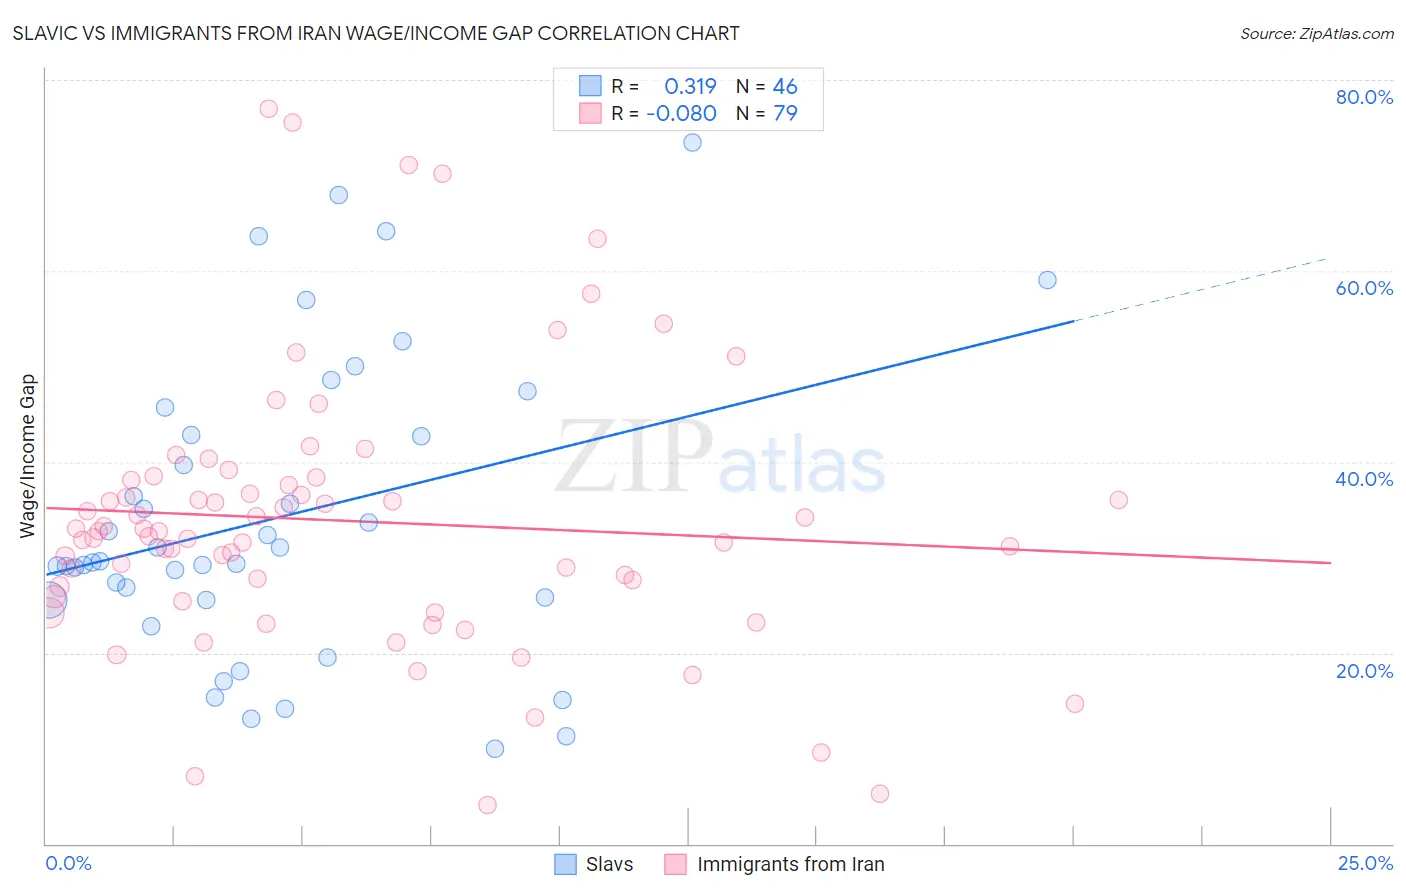
Slavic vs Immigrants from Iran Wage/Income Gap Correlation Chart
The statistical analysis conducted on geographies consisting of 270,754,650 people shows a mild positive correlation between the proportion of Slavs and wage/income gap percentage in the United States with a correlation coefficient (R) of 0.319 and weighted average of 27.4%. Similarly, the statistical analysis conducted on geographies consisting of 279,798,376 people shows a slight negative correlation between the proportion of Immigrants from Iran and wage/income gap percentage in the United States with a correlation coefficient (R) of -0.080 and weighted average of 29.1%, a difference of 6.0%.
Wage/Income Gap Correlation Summary
| Measurement | Slavic | Immigrants from Iran |
| Minimum | 10.0% | 4.0% |
| Maximum | 73.5% | 77.0% |
| Range | 63.5% | 73.0% |
| Mean | 34.2% | 33.8% |
| Median | 29.5% | 32.7% |
| Interquartile 25% (IQ1) | 25.6% | 25.9% |
| Interquartile 75% (IQ3) | 42.9% | 38.2% |
| Interquartile Range (IQR) | 17.3% | 12.3% |
| Standard Deviation (Sample) | 15.7% | 14.3% |
| Standard Deviation (Population) | 15.5% | 14.2% |
Similar Demographics by Wage/Income Gap
Demographics Similar to Slavs by Wage/Income Gap
In terms of wage/income gap, the demographic groups most similar to Slavs are Luxembourger (27.4%, a difference of 0.040%), Icelander (27.5%, a difference of 0.080%), Cherokee (27.4%, a difference of 0.090%), Tongan (27.5%, a difference of 0.090%), and Immigrants from France (27.4%, a difference of 0.19%).
| Demographics | Rating | Rank | Wage/Income Gap |
| Immigrants | Norway | 2.5 /100 | #251 | Tragic 27.3% |
| Ukrainians | 2.4 /100 | #252 | Tragic 27.3% |
| Portuguese | 2.2 /100 | #253 | Tragic 27.4% |
| Israelis | 2.1 /100 | #254 | Tragic 27.4% |
| Immigrants | France | 2.1 /100 | #255 | Tragic 27.4% |
| Cherokee | 1.9 /100 | #256 | Tragic 27.4% |
| Luxembourgers | 1.9 /100 | #257 | Tragic 27.4% |
| Slavs | 1.8 /100 | #258 | Tragic 27.4% |
| Icelanders | 1.8 /100 | #259 | Tragic 27.5% |
| Tongans | 1.7 /100 | #260 | Tragic 27.5% |
| Immigrants | Germany | 1.5 /100 | #261 | Tragic 27.5% |
| Immigrants | Lebanon | 1.5 /100 | #262 | Tragic 27.5% |
| Syrians | 1.4 /100 | #263 | Tragic 27.6% |
| Immigrants | Switzerland | 1.0 /100 | #264 | Tragic 27.7% |
| Serbians | 1.0 /100 | #265 | Tragic 27.7% |
Demographics Similar to Immigrants from Iran by Wage/Income Gap
In terms of wage/income gap, the demographic groups most similar to Immigrants from Iran are Scandinavian (29.1%, a difference of 0.060%), Immigrants from Belgium (29.0%, a difference of 0.11%), Hungarian (29.0%, a difference of 0.18%), Scottish (29.1%, a difference of 0.20%), and German (29.2%, a difference of 0.30%).
| Demographics | Rating | Rank | Wage/Income Gap |
| British | 0.1 /100 | #320 | Tragic 28.9% |
| Welsh | 0.1 /100 | #321 | Tragic 28.9% |
| Immigrants | Singapore | 0.1 /100 | #322 | Tragic 28.9% |
| Norwegians | 0.1 /100 | #323 | Tragic 29.0% |
| Croatians | 0.0 /100 | #324 | Tragic 29.0% |
| Hungarians | 0.0 /100 | #325 | Tragic 29.0% |
| Immigrants | Belgium | 0.0 /100 | #326 | Tragic 29.0% |
| Immigrants | Iran | 0.0 /100 | #327 | Tragic 29.1% |
| Scandinavians | 0.0 /100 | #328 | Tragic 29.1% |
| Scottish | 0.0 /100 | #329 | Tragic 29.1% |
| Germans | 0.0 /100 | #330 | Tragic 29.2% |
| Czechs | 0.0 /100 | #331 | Tragic 29.2% |
| Immigrants | South Central Asia | 0.0 /100 | #332 | Tragic 29.3% |
| Europeans | 0.0 /100 | #333 | Tragic 29.4% |
| Swedes | 0.0 /100 | #334 | Tragic 29.4% |