Slavic vs Immigrants from Iran 11th Grade
COMPARE
Slavic
Immigrants from Iran
11th Grade
11th Grade Comparison
Slavs
Immigrants from Iran
94.1%
11TH GRADE
99.9/ 100
METRIC RATING
49th/ 347
METRIC RANK
93.5%
11TH GRADE
98.9/ 100
METRIC RATING
97th/ 347
METRIC RANK
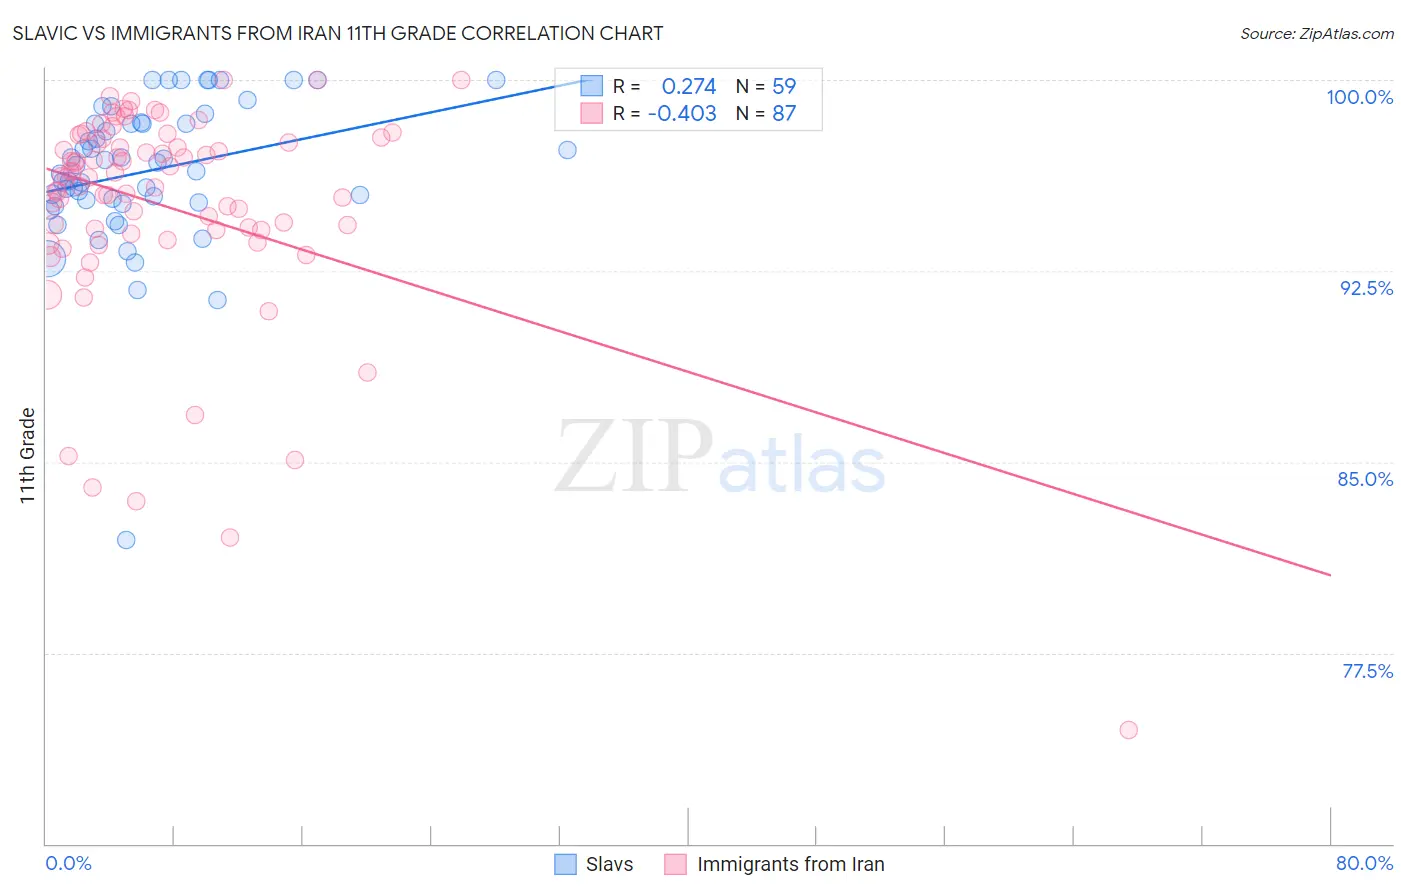
Slavic vs Immigrants from Iran 11th Grade Correlation Chart
The statistical analysis conducted on geographies consisting of 270,868,354 people shows a weak positive correlation between the proportion of Slavs and percentage of population with at least 11th grade education in the United States with a correlation coefficient (R) of 0.274 and weighted average of 94.1%. Similarly, the statistical analysis conducted on geographies consisting of 279,905,207 people shows a moderate negative correlation between the proportion of Immigrants from Iran and percentage of population with at least 11th grade education in the United States with a correlation coefficient (R) of -0.403 and weighted average of 93.5%, a difference of 0.57%.
11th Grade Correlation Summary
| Measurement | Slavic | Immigrants from Iran |
| Minimum | 81.9% | 74.5% |
| Maximum | 100.0% | 100.0% |
| Range | 18.1% | 25.5% |
| Mean | 96.4% | 95.0% |
| Median | 96.7% | 96.2% |
| Interquartile 25% (IQ1) | 95.2% | 94.1% |
| Interquartile 75% (IQ3) | 98.3% | 97.7% |
| Interquartile Range (IQR) | 3.1% | 3.6% |
| Standard Deviation (Sample) | 2.9% | 4.3% |
| Standard Deviation (Population) | 2.9% | 4.3% |
Similar Demographics by 11th Grade
Demographics Similar to Slavs by 11th Grade
In terms of 11th grade, the demographic groups most similar to Slavs are Filipino (94.1%, a difference of 0.0%), Macedonian (94.1%, a difference of 0.0%), French (94.1%, a difference of 0.0%), Serbian (94.1%, a difference of 0.010%), and Australian (94.1%, a difference of 0.020%).
| Demographics | Rating | Rank | 11th Grade |
| Immigrants | Austria | 99.9 /100 | #42 | Exceptional 94.1% |
| Greeks | 99.9 /100 | #43 | Exceptional 94.1% |
| Immigrants | Ireland | 99.9 /100 | #44 | Exceptional 94.1% |
| Australians | 99.9 /100 | #45 | Exceptional 94.1% |
| Serbians | 99.9 /100 | #46 | Exceptional 94.1% |
| Filipinos | 99.9 /100 | #47 | Exceptional 94.1% |
| Macedonians | 99.9 /100 | #48 | Exceptional 94.1% |
| Slavs | 99.9 /100 | #49 | Exceptional 94.1% |
| French | 99.9 /100 | #50 | Exceptional 94.1% |
| Turks | 99.9 /100 | #51 | Exceptional 94.0% |
| Immigrants | Canada | 99.9 /100 | #52 | Exceptional 94.0% |
| Immigrants | Australia | 99.9 /100 | #53 | Exceptional 94.0% |
| Immigrants | North America | 99.9 /100 | #54 | Exceptional 94.0% |
| Czechoslovakians | 99.9 /100 | #55 | Exceptional 94.0% |
| French Canadians | 99.9 /100 | #56 | Exceptional 94.0% |
Demographics Similar to Immigrants from Iran by 11th Grade
In terms of 11th grade, the demographic groups most similar to Immigrants from Iran are Immigrants from Turkey (93.5%, a difference of 0.010%), Immigrants from Israel (93.5%, a difference of 0.020%), Menominee (93.5%, a difference of 0.020%), Swiss (93.6%, a difference of 0.030%), and Immigrants from France (93.6%, a difference of 0.030%).
| Demographics | Rating | Rank | 11th Grade |
| Ottawa | 99.2 /100 | #90 | Exceptional 93.6% |
| South Africans | 99.2 /100 | #91 | Exceptional 93.6% |
| Immigrants | Bulgaria | 99.1 /100 | #92 | Exceptional 93.6% |
| Puget Sound Salish | 99.1 /100 | #93 | Exceptional 93.6% |
| Swiss | 99.0 /100 | #94 | Exceptional 93.6% |
| Immigrants | France | 99.0 /100 | #95 | Exceptional 93.6% |
| Immigrants | Turkey | 98.9 /100 | #96 | Exceptional 93.5% |
| Immigrants | Iran | 98.9 /100 | #97 | Exceptional 93.5% |
| Immigrants | Israel | 98.8 /100 | #98 | Exceptional 93.5% |
| Menominee | 98.7 /100 | #99 | Exceptional 93.5% |
| Immigrants | North Macedonia | 98.7 /100 | #100 | Exceptional 93.5% |
| Immigrants | Romania | 98.7 /100 | #101 | Exceptional 93.5% |
| Chippewa | 98.6 /100 | #102 | Exceptional 93.5% |
| Lebanese | 98.6 /100 | #103 | Exceptional 93.5% |
| Immigrants | Europe | 98.6 /100 | #104 | Exceptional 93.5% |