Slavic vs Immigrants from Iran Disability Age Under 5
COMPARE
Slavic
Immigrants from Iran
Disability Age Under 5
Disability Age Under 5 Comparison
Slavs
Immigrants from Iran
1.4%
DISABILITY AGE UNDER 5
0.3/ 100
METRIC RATING
260th/ 347
METRIC RANK
1.00%
DISABILITY AGE UNDER 5
100.0/ 100
METRIC RATING
22nd/ 347
METRIC RANK
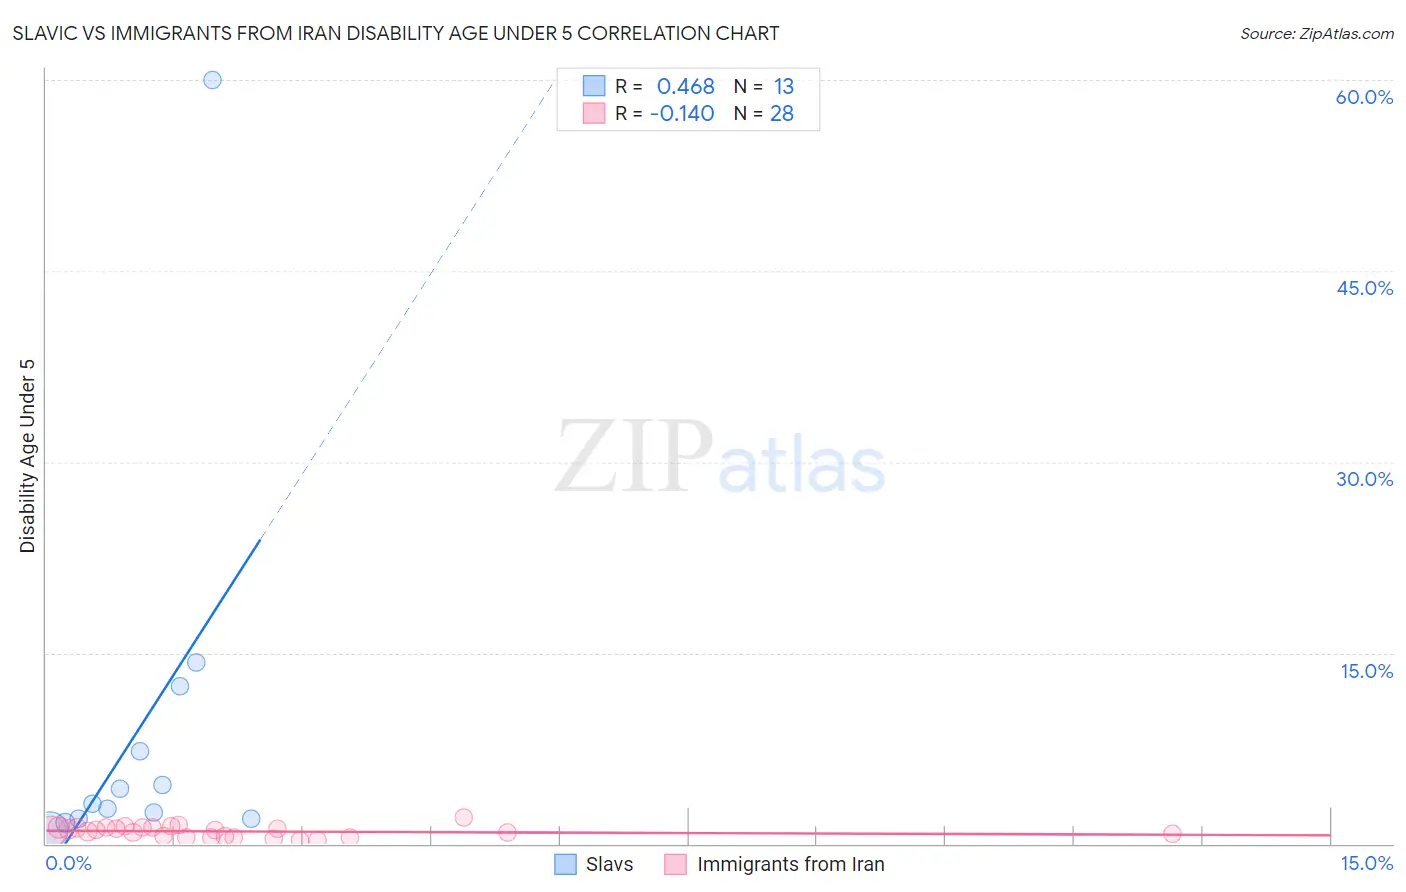
Slavic vs Immigrants from Iran Disability Age Under 5 Correlation Chart
The statistical analysis conducted on geographies consisting of 161,605,234 people shows a moderate positive correlation between the proportion of Slavs and percentage of population with a disability under the age of 5 in the United States with a correlation coefficient (R) of 0.468 and weighted average of 1.4%. Similarly, the statistical analysis conducted on geographies consisting of 168,672,244 people shows a poor negative correlation between the proportion of Immigrants from Iran and percentage of population with a disability under the age of 5 in the United States with a correlation coefficient (R) of -0.140 and weighted average of 1.00%, a difference of 41.0%.
Disability Age Under 5 Correlation Summary
| Measurement | Slavic | Immigrants from Iran |
| Minimum | 1.0% | 0.30% |
| Maximum | 60.0% | 2.1% |
| Range | 59.0% | 1.8% |
| Mean | 9.1% | 0.97% |
| Median | 3.1% | 1.0% |
| Interquartile 25% (IQ1) | 2.0% | 0.54% |
| Interquartile 75% (IQ3) | 9.8% | 1.3% |
| Interquartile Range (IQR) | 7.8% | 0.73% |
| Standard Deviation (Sample) | 15.9% | 0.43% |
| Standard Deviation (Population) | 15.2% | 0.42% |
Similar Demographics by Disability Age Under 5
Demographics Similar to Slavs by Disability Age Under 5
In terms of disability age under 5, the demographic groups most similar to Slavs are Immigrants from Southern Europe (1.4%, a difference of 0.21%), Costa Rican (1.4%, a difference of 0.37%), Slovene (1.4%, a difference of 0.55%), Immigrants from Netherlands (1.4%, a difference of 0.67%), and Immigrants from Dominica (1.4%, a difference of 0.83%).
| Demographics | Rating | Rank | Disability Age Under 5 |
| Australians | 0.7 /100 | #253 | Tragic 1.4% |
| Immigrants | Brazil | 0.7 /100 | #254 | Tragic 1.4% |
| Immigrants | Liberia | 0.6 /100 | #255 | Tragic 1.4% |
| Immigrants | Western Europe | 0.5 /100 | #256 | Tragic 1.4% |
| Slovenes | 0.3 /100 | #257 | Tragic 1.4% |
| Costa Ricans | 0.3 /100 | #258 | Tragic 1.4% |
| Immigrants | Southern Europe | 0.3 /100 | #259 | Tragic 1.4% |
| Slavs | 0.3 /100 | #260 | Tragic 1.4% |
| Immigrants | Netherlands | 0.2 /100 | #261 | Tragic 1.4% |
| Immigrants | Dominica | 0.2 /100 | #262 | Tragic 1.4% |
| Spanish | 0.2 /100 | #263 | Tragic 1.4% |
| Yugoslavians | 0.1 /100 | #264 | Tragic 1.4% |
| Carpatho Rusyns | 0.1 /100 | #265 | Tragic 1.4% |
| Immigrants | Germany | 0.1 /100 | #266 | Tragic 1.4% |
| Cree | 0.1 /100 | #267 | Tragic 1.4% |
Demographics Similar to Immigrants from Iran by Disability Age Under 5
In terms of disability age under 5, the demographic groups most similar to Immigrants from Iran are Yakama (1.00%, a difference of 0.080%), Indian (Asian) (1.0%, a difference of 0.36%), Immigrants from Micronesia (1.0%, a difference of 0.67%), British West Indian (0.99%, a difference of 0.79%), and Immigrants from Taiwan (1.0%, a difference of 0.79%).
| Demographics | Rating | Rank | Disability Age Under 5 |
| Immigrants | Hong Kong | 100.0 /100 | #15 | Exceptional 0.95% |
| Immigrants | Israel | 100.0 /100 | #16 | Exceptional 0.96% |
| Immigrants | China | 100.0 /100 | #17 | Exceptional 0.96% |
| Immigrants | Barbados | 100.0 /100 | #18 | Exceptional 0.97% |
| Puget Sound Salish | 100.0 /100 | #19 | Exceptional 0.97% |
| Nepalese | 100.0 /100 | #20 | Exceptional 0.97% |
| British West Indians | 100.0 /100 | #21 | Exceptional 0.99% |
| Immigrants | Iran | 100.0 /100 | #22 | Exceptional 1.00% |
| Yakama | 100.0 /100 | #23 | Exceptional 1.00% |
| Indians (Asian) | 100.0 /100 | #24 | Exceptional 1.0% |
| Immigrants | Micronesia | 100.0 /100 | #25 | Exceptional 1.0% |
| Immigrants | Taiwan | 100.0 /100 | #26 | Exceptional 1.0% |
| Guyanese | 100.0 /100 | #27 | Exceptional 1.0% |
| Immigrants | Eastern Asia | 100.0 /100 | #28 | Exceptional 1.0% |
| Immigrants | Belarus | 100.0 /100 | #29 | Exceptional 1.0% |