Immigrants from Uzbekistan vs Immigrants from Iran Disability

COMPARE

Immigrants from Uzbekistan
Race
Ancestry
AfghanAfricanAlaska NativeAlaskan AthabascanAlbanianAleutAlsatianAmericanApacheArabArapahoArgentineanArmenianAssyrian/Chaldean/SyriacAustralianAustrianBahamianBangladeshiBarbadianBasqueBelgianBelizeanBermudanBhutaneseBlackfeetBolivianBrazilianBritishBritish West IndianBulgarianBurmeseCajunCambodianCanadianCape VerdeanCarpatho RusynCelticCentral AmericanCentral American IndianCherokeeCheyenneChickasawChileanChineseChippewaChoctawColombianColvilleComancheCosta RicanCreeCreekCroatianCrowCubanCypriotCzechCzechoslovakianDanishDelawareDominicanDutchDutch West IndianEastern EuropeanEcuadorianEgyptianEnglishEstonianEthiopianEuropeanFijianFilipinoFinnishFrenchFrench American IndianFrench CanadianGermanGerman RussianGhanaianGreekGuamanian/ChamorroGuatemalanGuyaneseHaitianHmongHonduranHopiHoumaHungarianIcelanderIndian (Asian)IndonesianInupiatIranianIraqiIrishIroquoisIsraeliItalianJamaicanJapaneseJordanianKenyanKiowaKoreanLaotianLatvianLebaneseLiberianLithuanianLumbeeLuxembourgerMacedonianMalaysianMalteseMarshalleseMenomineeMexicanMexican American IndianMongolianMoroccanNative HawaiianNavajoNepaleseNew ZealanderNicaraguanNigerianNorthern EuropeanNorwegianOkinawanOsageOttawaPaiutePakistaniPalestinianPanamanianParaguayanPennsylvania GermanPeruvianPimaPolishPortuguesePotawatomiPuebloPuerto RicanPuget Sound SalishRomanianRussianSalvadoranSamoanScandinavianScotch-IrishScottishSeminoleSenegaleseSerbianShoshoneSierra LeoneanSiouxSlavicSlovakSloveneSomaliSouth AfricanSouth AmericanSouth American IndianSoviet UnionSpaniardSpanishSpanish AmericanSpanish American IndianSri LankanSubsaharan AfricanSudaneseSwedishSwissSyrianTaiwaneseThaiTlingit-HaidaTohono O'OdhamTonganTrinidadian and TobagonianTsimshianTurkishU.S. Virgin IslanderUgandanUkrainianUruguayanUteVenezuelanVietnameseWelshWest IndianYakamaYaquiYugoslavianYumanYup'ikZimbabwean
Immigration
NonimmigrantsImmigrantsAfghanistanAfricaAlbaniaArgentinaArmeniaAsiaAustraliaAustriaBahamasBangladeshBarbadosBelarusBelgiumBelizeBoliviaBosnia and HerzegovinaBrazilBulgariaBurma/MyanmarCabo VerdeCambodiaCameroonCanadaCaribbeanCentral AmericaChileChinaColombiaCongoCosta RicaCroatiaCubaCzechoslovakiaDenmarkDominicaDominican RepublicEastern AfricaEastern AsiaEastern EuropeEcuadorEgyptEl SalvadorEnglandEritreaEthiopiaEuropeFijiFranceGermanyGhanaGreeceGrenadaGuatemalaGuyanaHaitiHondurasHong KongHungaryIndiaIndonesiaIraqIrelandIsraelItalyJamaicaJapanJordanKazakhstanKenyaKoreaKuwaitLaosLatin AmericaLatviaLebanonLiberiaLithuaniaMalaysiaMexicoMicronesiaMiddle AfricaMoldovaMoroccoNepalNetherlandsNicaraguaNigeriaNorth AmericaNorth MacedoniaNorthern AfricaNorthern EuropeNorwayOceaniaPakistanPanamaPeruPhilippinesPolandPortugalRomaniaRussiaSaudi ArabiaScotlandSenegalSerbiaSierra LeoneSingaporeSomaliaSouth AfricaSouth AmericaSouth Central AsiaSouth Eastern AsiaSouthern EuropeSpainSri LankaSt. Vincent and the GrenadinesSudanSwedenSwitzerlandSyriaTaiwanThailandTrinidad and TobagoTurkeyUgandaUkraineUruguayUzbekistanVenezuelaVietnamWest IndiesWestern AfricaWestern AsiaWestern EuropeYemenZaireZimbabweAzores
Immigrants from Iran
Race
Ancestry
AfghanAfricanAlaska NativeAlaskan AthabascanAlbanianAleutAlsatianAmericanApacheArabArapahoArgentineanArmenianAssyrian/Chaldean/SyriacAustralianAustrianBahamianBangladeshiBarbadianBasqueBelgianBelizeanBermudanBhutaneseBlackfeetBolivianBrazilianBritishBritish West IndianBulgarianBurmeseCajunCambodianCanadianCape VerdeanCarpatho RusynCelticCentral AmericanCentral American IndianCherokeeCheyenneChickasawChileanChineseChippewaChoctawColombianColvilleComancheCosta RicanCreeCreekCroatianCrowCubanCypriotCzechCzechoslovakianDanishDelawareDominicanDutchDutch West IndianEastern EuropeanEcuadorianEgyptianEnglishEstonianEthiopianEuropeanFijianFilipinoFinnishFrenchFrench American IndianFrench CanadianGermanGerman RussianGhanaianGreekGuamanian/ChamorroGuatemalanGuyaneseHaitianHmongHonduranHopiHoumaHungarianIcelanderIndian (Asian)IndonesianInupiatIranianIraqiIrishIroquoisIsraeliItalianJamaicanJapaneseJordanianKenyanKiowaKoreanLaotianLatvianLebaneseLiberianLithuanianLumbeeLuxembourgerMacedonianMalaysianMalteseMarshalleseMenomineeMexicanMexican American IndianMongolianMoroccanNative HawaiianNavajoNepaleseNew ZealanderNicaraguanNigerianNorthern EuropeanNorwegianOkinawanOsageOttawaPaiutePakistaniPalestinianPanamanianParaguayanPennsylvania GermanPeruvianPimaPolishPortuguesePotawatomiPuebloPuerto RicanPuget Sound SalishRomanianRussianSalvadoranSamoanScandinavianScotch-IrishScottishSeminoleSenegaleseSerbianShoshoneSierra LeoneanSiouxSlavicSlovakSloveneSomaliSouth AfricanSouth AmericanSouth American IndianSoviet UnionSpaniardSpanishSpanish AmericanSpanish American IndianSri LankanSubsaharan AfricanSudaneseSwedishSwissSyrianTaiwaneseThaiTlingit-HaidaTohono O'OdhamTonganTrinidadian and TobagonianTsimshianTurkishU.S. Virgin IslanderUgandanUkrainianUruguayanUteVenezuelanVietnameseWelshWest IndianYakamaYaquiYugoslavianYumanYup'ikZimbabwean
Immigration
NonimmigrantsImmigrantsAfghanistanAfricaAlbaniaArgentinaArmeniaAsiaAustraliaAustriaBahamasBangladeshBarbadosBelarusBelgiumBelizeBoliviaBosnia and HerzegovinaBrazilBulgariaBurma/MyanmarCabo VerdeCambodiaCameroonCanadaCaribbeanCentral AmericaChileChinaColombiaCongoCosta RicaCroatiaCubaCzechoslovakiaDenmarkDominicaDominican RepublicEastern AfricaEastern AsiaEastern EuropeEcuadorEgyptEl SalvadorEnglandEritreaEthiopiaEuropeFijiFranceGermanyGhanaGreeceGrenadaGuatemalaGuyanaHaitiHondurasHong KongHungaryIndiaIndonesiaIranIraqIrelandIsraelItalyJamaicaJapanJordanKazakhstanKenyaKoreaKuwaitLaosLatin AmericaLatviaLebanonLiberiaLithuaniaMalaysiaMexicoMicronesiaMiddle AfricaMoldovaMoroccoNepalNetherlandsNicaraguaNigeriaNorth AmericaNorth MacedoniaNorthern AfricaNorthern EuropeNorwayOceaniaPakistanPanamaPeruPhilippinesPolandPortugalRomaniaRussiaSaudi ArabiaScotlandSenegalSerbiaSierra LeoneSingaporeSomaliaSouth AfricaSouth AmericaSouth Central AsiaSouth Eastern AsiaSouthern EuropeSpainSri LankaSt. Vincent and the GrenadinesSudanSwedenSwitzerlandSyriaTaiwanThailandTrinidad and TobagoTurkeyUgandaUkraineUruguayVenezuelaVietnamWest IndiesWestern AfricaWestern AsiaWestern EuropeYemenZaireZimbabweAzores
Disability
Income
Poverty
Unemployment
Labor Participation
Family Structure
Vehicle Availability
Education Level
Disability

Disability Comparison

Immigrants from Uzbekistan

Immigrants from Iran

Exceptional
Exceptional
11.3%
DISABILITY
94.9/ 100
METRIC RATING
112th/ 347
METRIC RANK
10.3%
DISABILITY
100.0/ 100
METRIC RATING
17th/ 347
METRIC RANK

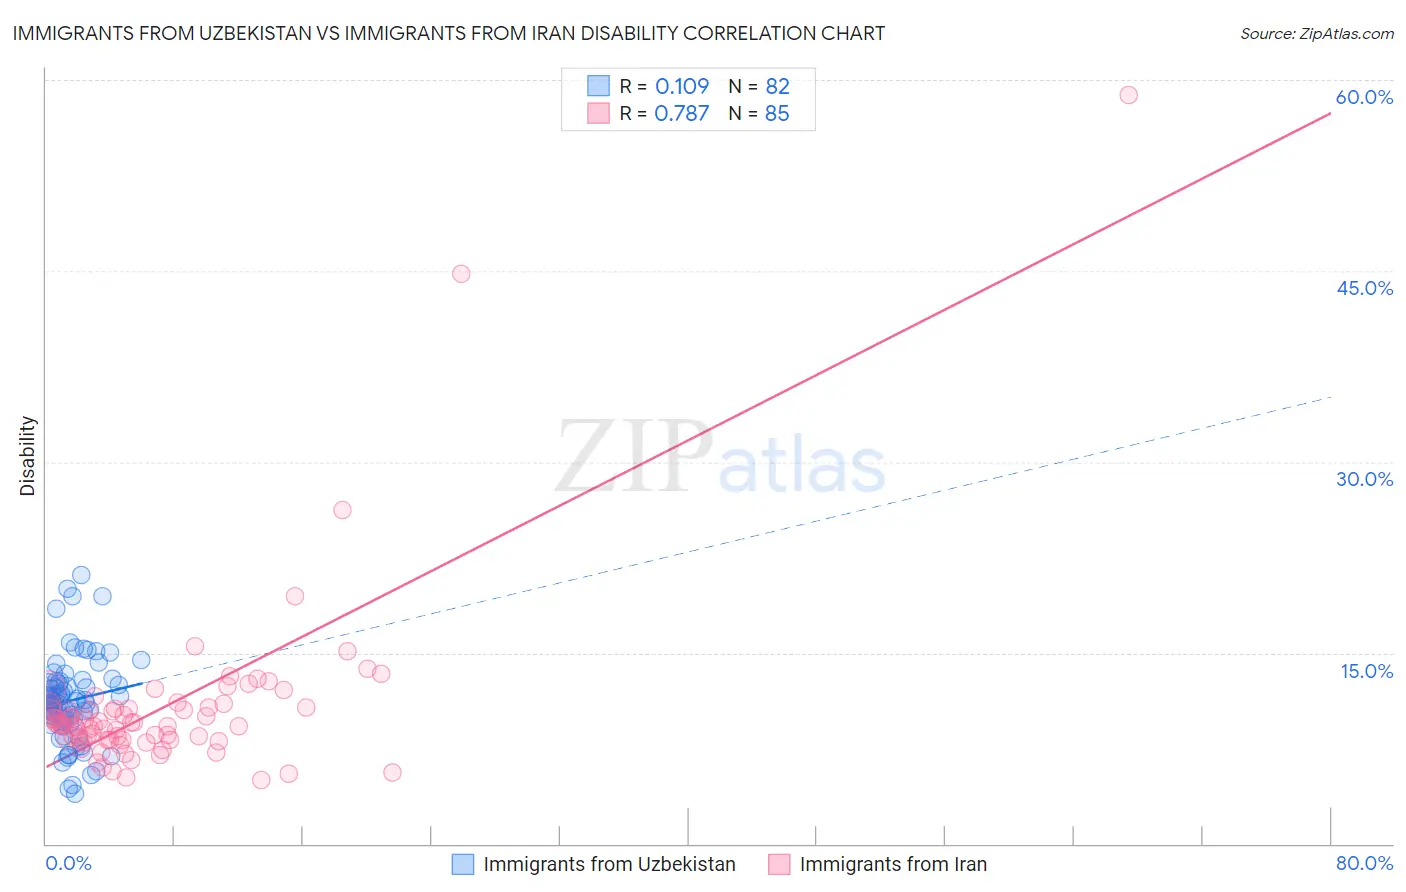
Immigrants from Uzbekistan vs Immigrants from Iran Disability Correlation Chart

The statistical analysis conducted on geographies consisting of 118,739,828 people shows a poor positive correlation between the proportion of Immigrants from Uzbekistan and percentage of population with a disability in the United States with a correlation coefficient (R) of 0.109 and weighted average of 11.3%. Similarly, the statistical analysis conducted on geographies consisting of 279,897,593 people shows a strong positive correlation between the proportion of Immigrants from Iran and percentage of population with a disability in the United States with a correlation coefficient (R) of 0.787 and weighted average of 10.3%, a difference of 10.3%.
Immigrants from Uzbekistan vs Immigrants from Iran Disability

Disability Correlation Summary

MeasurementImmigrants from UzbekistanImmigrants from Iran
Minimum4.0%5.0%
Maximum21.1%58.9%
Range17.2%53.8%
Mean11.2%10.7%
Median11.2%9.3%
Interquartile 25% (IQ1)9.8%8.1%
Interquartile 75% (IQ3)12.7%10.7%
Interquartile Range (IQR)2.9%2.6%
Standard Deviation (Sample)3.4%7.2%
Standard Deviation (Population)3.4%7.1%

Similar Demographics by Disability

Demographics Similar to Immigrants from Uzbekistan by Disability

In terms of disability, the demographic groups most similar to Immigrants from Uzbekistan are Guyanese (11.3%, a difference of 0.040%), Immigrants from Syria (11.3%, a difference of 0.050%), Immigrants from Philippines (11.3%, a difference of 0.060%), Immigrants from South Eastern Asia (11.3%, a difference of 0.12%), and Immigrants from Northern Europe (11.3%, a difference of 0.17%).
DemographicsRating | RankDisability
Immigrants | Kazakhstan
96.4
/100
|
#105
Exceptional
11.3%
Immigrants | Eastern Europe
96.3
/100
|
#106
Exceptional
11.3%
Nicaraguans
96.2
/100
|
#107
Exceptional
11.3%
Immigrants | Nigeria
96.0
/100
|
#108
Exceptional
11.3%
Immigrants | Uganda
95.7
/100
|
#109
Exceptional
11.3%
Immigrants | Denmark
95.6
/100
|
#110
Exceptional
11.3%
Immigrants | South Eastern Asia
95.4
/100
|
#111
Exceptional
11.3%
Immigrants | Uzbekistan
94.9
/100
|
#112
Exceptional
11.3%
Guyanese
94.7
/100
|
#113
Exceptional
11.3%
Immigrants | Syria
94.7
/100
|
#114
Exceptional
11.3%
Immigrants | Philippines
94.6
/100
|
#115
Exceptional
11.3%
Immigrants | Northern Europe
94.1
/100
|
#116
Exceptional
11.3%
Luxembourgers
93.9
/100
|
#117
Exceptional
11.3%
Koreans
93.8
/100
|
#118
Exceptional
11.3%
Central Americans
93.5
/100
|
#119
Exceptional
11.4%

Demographics Similar to Immigrants from Iran by Disability

In terms of disability, the demographic groups most similar to Immigrants from Iran are Indian (Asian) (10.3%, a difference of 0.070%), Okinawan (10.3%, a difference of 0.13%), Immigrants from Korea (10.2%, a difference of 0.44%), Burmese (10.4%, a difference of 0.99%), and Immigrants from Pakistan (10.4%, a difference of 0.99%).
DemographicsRating | RankDisability
Immigrants | China
100.0
/100
|
#10
Exceptional
10.1%
Iranians
100.0
/100
|
#11
Exceptional
10.1%
Immigrants | Israel
100.0
/100
|
#12
Exceptional
10.1%
Immigrants | Eastern Asia
100.0
/100
|
#13
Exceptional
10.2%
Immigrants | Korea
100.0
/100
|
#14
Exceptional
10.2%
Okinawans
100.0
/100
|
#15
Exceptional
10.3%
Indians (Asian)
100.0
/100
|
#16
Exceptional
10.3%
Immigrants | Iran
100.0
/100
|
#17
Exceptional
10.3%
Burmese
100.0
/100
|
#18
Exceptional
10.4%
Immigrants | Pakistan
100.0
/100
|
#19
Exceptional
10.4%
Immigrants | Venezuela
100.0
/100
|
#20
Exceptional
10.4%
Asians
100.0
/100
|
#21
Exceptional
10.4%
Immigrants | Sri Lanka
100.0
/100
|
#22
Exceptional
10.5%
Immigrants | Asia
100.0
/100
|
#23
Exceptional
10.5%
Venezuelans
100.0
/100
|
#24
Exceptional
10.5%