Slavic vs German Disability
COMPARE
Slavic
German
Disability
Disability Comparison
Slavs
Germans
12.4%
DISABILITY
0.5/ 100
METRIC RATING
258th/ 347
METRIC RANK
12.8%
DISABILITY
0.0/ 100
METRIC RATING
278th/ 347
METRIC RANK
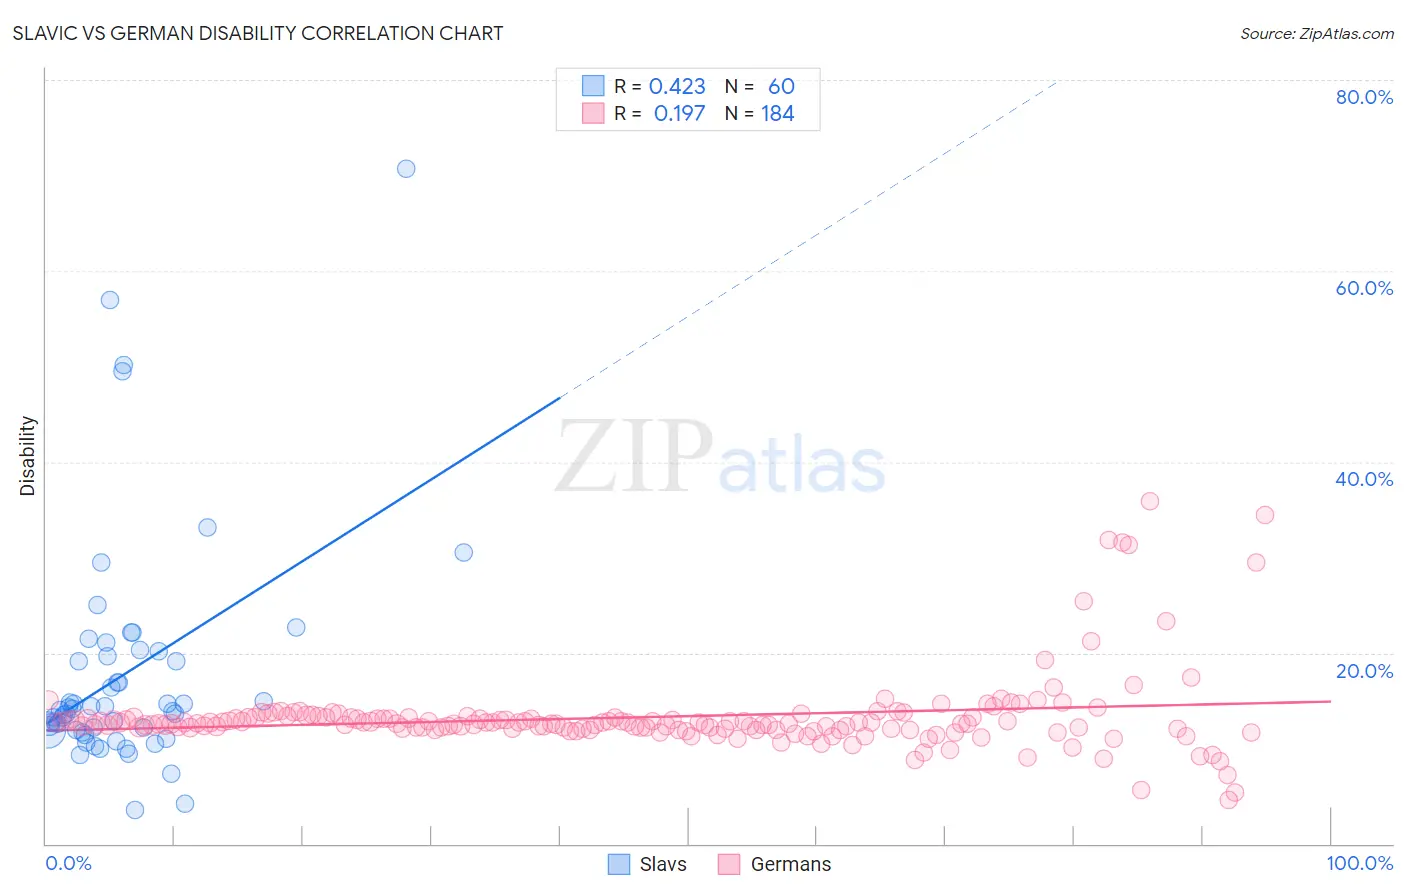
Slavic vs German Disability Correlation Chart
The statistical analysis conducted on geographies consisting of 270,861,742 people shows a moderate positive correlation between the proportion of Slavs and percentage of population with a disability in the United States with a correlation coefficient (R) of 0.423 and weighted average of 12.4%. Similarly, the statistical analysis conducted on geographies consisting of 581,054,962 people shows a poor positive correlation between the proportion of Germans and percentage of population with a disability in the United States with a correlation coefficient (R) of 0.197 and weighted average of 12.8%, a difference of 3.5%.
Disability Correlation Summary
| Measurement | Slavic | German |
| Minimum | 3.5% | 4.5% |
| Maximum | 70.6% | 35.9% |
| Range | 67.1% | 31.4% |
| Mean | 17.8% | 13.3% |
| Median | 14.0% | 12.6% |
| Interquartile 25% (IQ1) | 11.9% | 12.0% |
| Interquartile 75% (IQ3) | 19.9% | 13.2% |
| Interquartile Range (IQR) | 7.9% | 1.2% |
| Standard Deviation (Sample) | 12.1% | 4.2% |
| Standard Deviation (Population) | 12.0% | 4.2% |
Demographics Similar to Slavs and Germans by Disability
In terms of disability, the demographic groups most similar to Slavs are Canadian (12.4%, a difference of 0.060%), Immigrants from Liberia (12.4%, a difference of 0.090%), Scandinavian (12.4%, a difference of 0.16%), Native Hawaiian (12.5%, a difference of 0.43%), and Hawaiian (12.5%, a difference of 0.64%). Similarly, the demographic groups most similar to Germans are Dutch (12.8%, a difference of 0.17%), Hmong (12.8%, a difference of 0.22%), Sioux (12.8%, a difference of 0.37%), Nepalese (12.8%, a difference of 0.45%), and Finnish (12.7%, a difference of 0.88%).
| Demographics | Rating | Rank | Disability |
| Slavs | 0.5 /100 | #258 | Tragic 12.4% |
| Canadians | 0.4 /100 | #259 | Tragic 12.4% |
| Immigrants | Liberia | 0.4 /100 | #260 | Tragic 12.4% |
| Scandinavians | 0.4 /100 | #261 | Tragic 12.4% |
| Native Hawaiians | 0.3 /100 | #262 | Tragic 12.5% |
| Hawaiians | 0.2 /100 | #263 | Tragic 12.5% |
| Immigrants | Germany | 0.2 /100 | #264 | Tragic 12.5% |
| U.S. Virgin Islanders | 0.2 /100 | #265 | Tragic 12.5% |
| Czechoslovakians | 0.2 /100 | #266 | Tragic 12.5% |
| Spaniards | 0.2 /100 | #267 | Tragic 12.5% |
| Bangladeshis | 0.1 /100 | #268 | Tragic 12.6% |
| Immigrants | Dominican Republic | 0.1 /100 | #269 | Tragic 12.6% |
| Portuguese | 0.1 /100 | #270 | Tragic 12.6% |
| Immigrants | Yemen | 0.1 /100 | #271 | Tragic 12.6% |
| Dominicans | 0.0 /100 | #272 | Tragic 12.7% |
| Finns | 0.0 /100 | #273 | Tragic 12.7% |
| Nepalese | 0.0 /100 | #274 | Tragic 12.8% |
| Sioux | 0.0 /100 | #275 | Tragic 12.8% |
| Hmong | 0.0 /100 | #276 | Tragic 12.8% |
| Dutch | 0.0 /100 | #277 | Tragic 12.8% |
| Germans | 0.0 /100 | #278 | Tragic 12.8% |