Slavic vs Immigrants from Iran No Schooling Completed
COMPARE
Slavic
Immigrants from Iran
No Schooling Completed
No Schooling Completed Comparison
Slavs
Immigrants from Iran
1.7%
NO SCHOOLING COMPLETED
99.8/ 100
METRIC RATING
59th/ 347
METRIC RANK
2.0%
NO SCHOOLING COMPLETED
79.0/ 100
METRIC RATING
145th/ 347
METRIC RANK
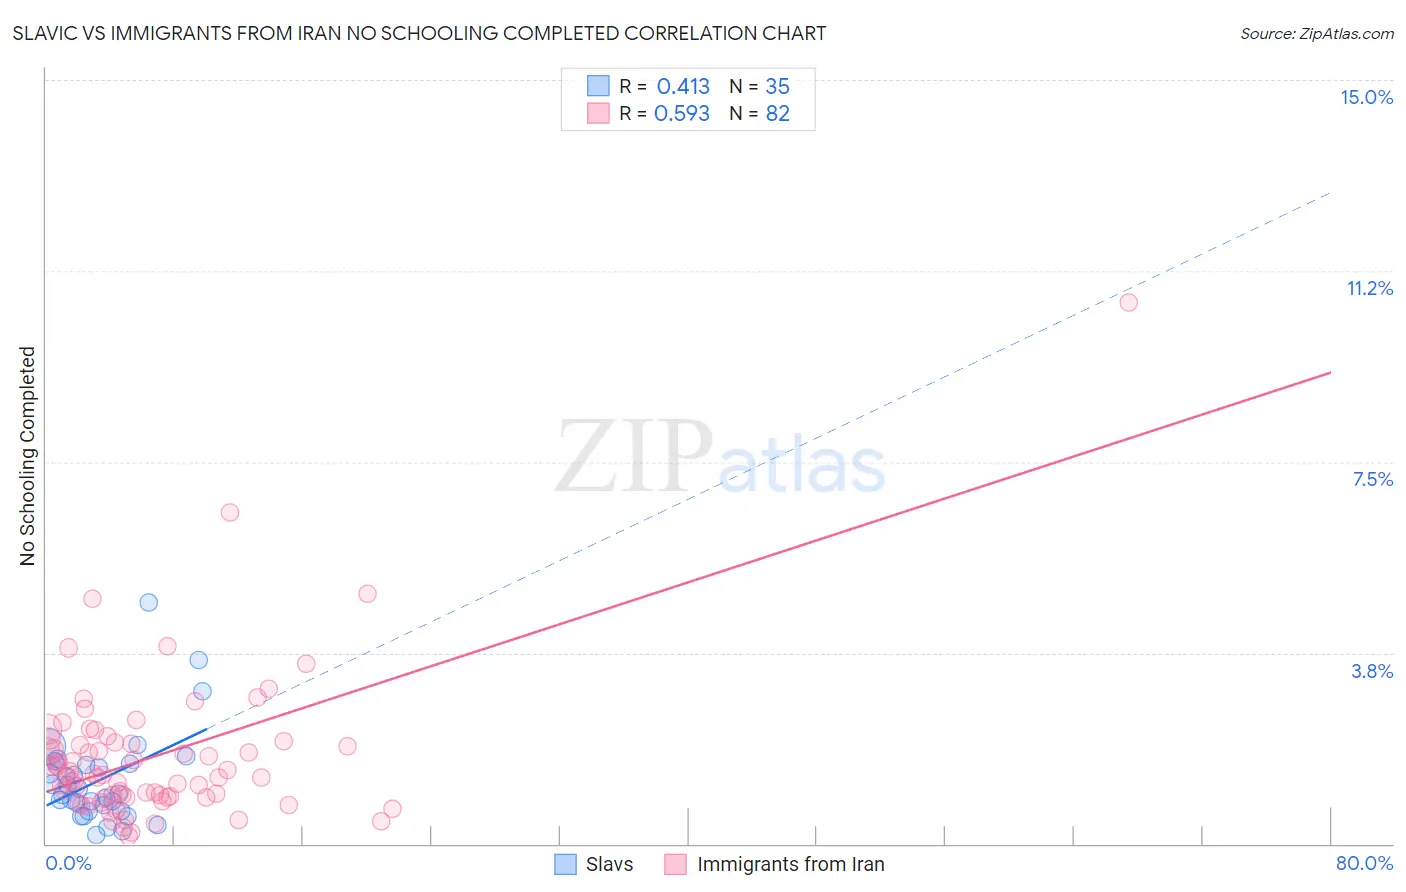
Slavic vs Immigrants from Iran No Schooling Completed Correlation Chart
The statistical analysis conducted on geographies consisting of 268,525,041 people shows a moderate positive correlation between the proportion of Slavs and percentage of population with no schooling in the United States with a correlation coefficient (R) of 0.413 and weighted average of 1.7%. Similarly, the statistical analysis conducted on geographies consisting of 278,243,234 people shows a substantial positive correlation between the proportion of Immigrants from Iran and percentage of population with no schooling in the United States with a correlation coefficient (R) of 0.593 and weighted average of 2.0%, a difference of 21.1%.
No Schooling Completed Correlation Summary
| Measurement | Slavic | Immigrants from Iran |
| Minimum | 0.17% | 0.14% |
| Maximum | 4.7% | 10.6% |
| Range | 4.6% | 10.5% |
| Mean | 1.3% | 1.7% |
| Median | 0.98% | 1.3% |
| Interquartile 25% (IQ1) | 0.64% | 0.91% |
| Interquartile 75% (IQ3) | 1.6% | 2.0% |
| Interquartile Range (IQR) | 0.93% | 1.1% |
| Standard Deviation (Sample) | 0.94% | 1.5% |
| Standard Deviation (Population) | 0.93% | 1.5% |
Similar Demographics by No Schooling Completed
Demographics Similar to Slavs by No Schooling Completed
In terms of no schooling completed, the demographic groups most similar to Slavs are Kiowa (1.6%, a difference of 0.070%), American (1.7%, a difference of 0.12%), Austrian (1.6%, a difference of 0.23%), Tsimshian (1.7%, a difference of 0.42%), and Greek (1.6%, a difference of 0.54%).
| Demographics | Rating | Rank | No Schooling Completed |
| Immigrants | Canada | 99.8 /100 | #52 | Exceptional 1.6% |
| Creek | 99.8 /100 | #53 | Exceptional 1.6% |
| Crow | 99.8 /100 | #54 | Exceptional 1.6% |
| Greeks | 99.8 /100 | #55 | Exceptional 1.6% |
| Immigrants | North America | 99.8 /100 | #56 | Exceptional 1.6% |
| Austrians | 99.8 /100 | #57 | Exceptional 1.6% |
| Kiowa | 99.8 /100 | #58 | Exceptional 1.6% |
| Slavs | 99.8 /100 | #59 | Exceptional 1.7% |
| Americans | 99.8 /100 | #60 | Exceptional 1.7% |
| Tsimshian | 99.8 /100 | #61 | Exceptional 1.7% |
| Immigrants | Northern Europe | 99.8 /100 | #62 | Exceptional 1.7% |
| Russians | 99.8 /100 | #63 | Exceptional 1.7% |
| New Zealanders | 99.7 /100 | #64 | Exceptional 1.7% |
| Serbians | 99.7 /100 | #65 | Exceptional 1.7% |
| Canadians | 99.7 /100 | #66 | Exceptional 1.7% |
Demographics Similar to Immigrants from Iran by No Schooling Completed
In terms of no schooling completed, the demographic groups most similar to Immigrants from Iran are Alsatian (2.0%, a difference of 0.010%), Immigrants from South Central Asia (2.0%, a difference of 0.21%), Immigrants from Moldova (2.0%, a difference of 0.21%), Soviet Union (2.0%, a difference of 0.39%), and Shoshone (2.0%, a difference of 0.47%).
| Demographics | Rating | Rank | No Schooling Completed |
| Immigrants | Israel | 85.4 /100 | #138 | Excellent 2.0% |
| Jordanians | 84.5 /100 | #139 | Excellent 2.0% |
| Marshallese | 83.5 /100 | #140 | Excellent 2.0% |
| Immigrants | Greece | 83.5 /100 | #141 | Excellent 2.0% |
| Venezuelans | 81.5 /100 | #142 | Excellent 2.0% |
| Immigrants | South Central Asia | 80.0 /100 | #143 | Good 2.0% |
| Alsatians | 79.1 /100 | #144 | Good 2.0% |
| Immigrants | Iran | 79.0 /100 | #145 | Good 2.0% |
| Immigrants | Moldova | 78.0 /100 | #146 | Good 2.0% |
| Soviet Union | 77.1 /100 | #147 | Good 2.0% |
| Shoshone | 76.7 /100 | #148 | Good 2.0% |
| Immigrants | North Macedonia | 75.9 /100 | #149 | Good 2.0% |
| Blackfeet | 72.9 /100 | #150 | Good 2.0% |
| Immigrants | Jordan | 70.9 /100 | #151 | Good 2.0% |
| Immigrants | Eastern Europe | 70.4 /100 | #152 | Good 2.0% |