Slavic vs Immigrants from Ukraine Disability
COMPARE
Slavic
Immigrants from Ukraine
Disability
Disability Comparison
Slavs
Immigrants from Ukraine
12.4%
DISABILITY
0.5/ 100
METRIC RATING
258th/ 347
METRIC RANK
11.5%
DISABILITY
77.6/ 100
METRIC RATING
147th/ 347
METRIC RANK
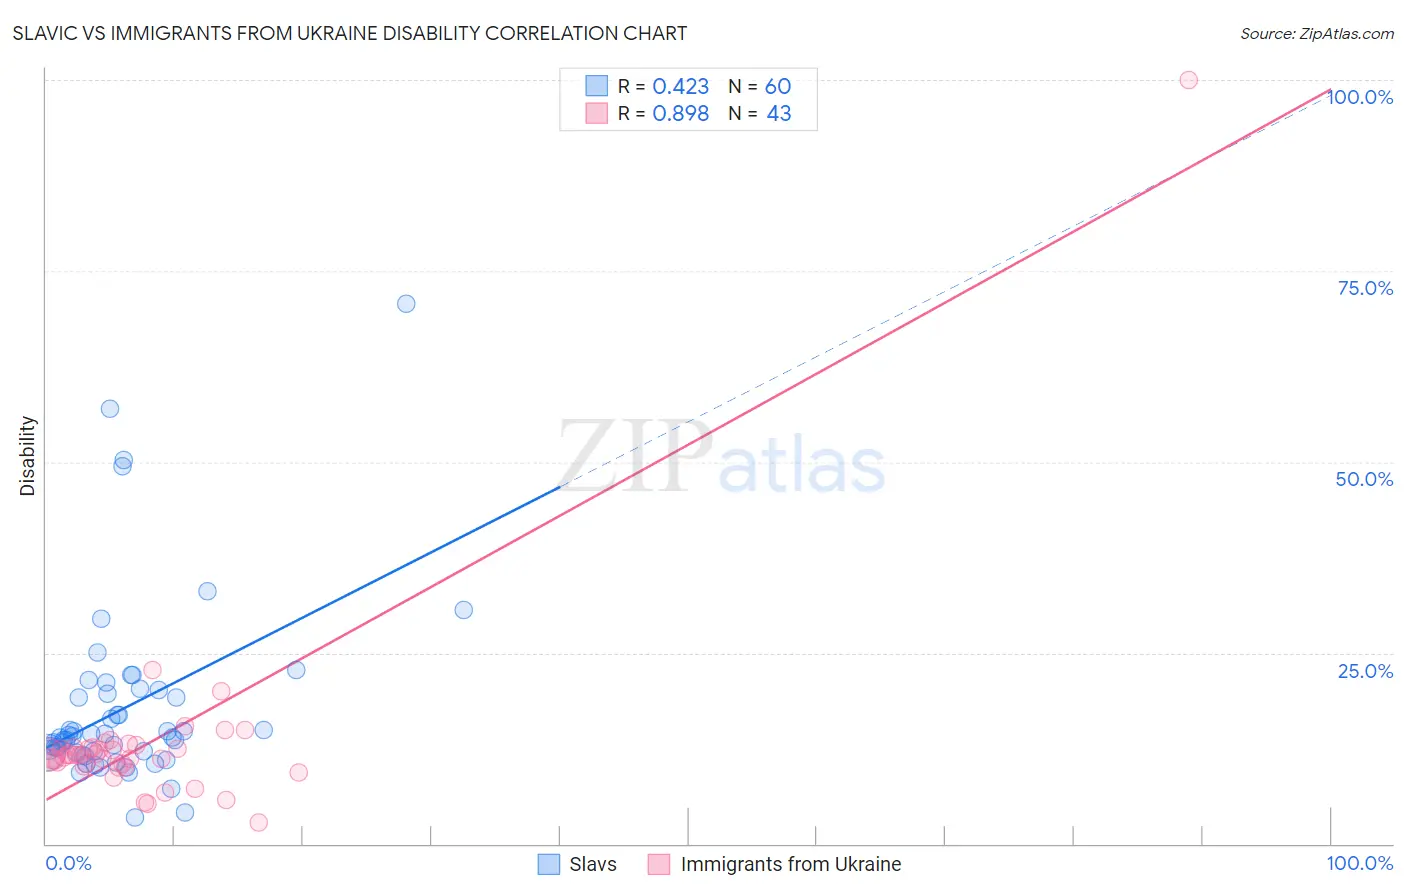
Slavic vs Immigrants from Ukraine Disability Correlation Chart
The statistical analysis conducted on geographies consisting of 270,861,742 people shows a moderate positive correlation between the proportion of Slavs and percentage of population with a disability in the United States with a correlation coefficient (R) of 0.423 and weighted average of 12.4%. Similarly, the statistical analysis conducted on geographies consisting of 289,688,276 people shows a very strong positive correlation between the proportion of Immigrants from Ukraine and percentage of population with a disability in the United States with a correlation coefficient (R) of 0.898 and weighted average of 11.5%, a difference of 7.4%.
Disability Correlation Summary
| Measurement | Slavic | Immigrants from Ukraine |
| Minimum | 3.5% | 2.9% |
| Maximum | 70.6% | 100.0% |
| Range | 67.1% | 97.1% |
| Mean | 17.8% | 13.4% |
| Median | 14.0% | 11.7% |
| Interquartile 25% (IQ1) | 11.9% | 10.2% |
| Interquartile 75% (IQ3) | 19.9% | 12.7% |
| Interquartile Range (IQR) | 7.9% | 2.5% |
| Standard Deviation (Sample) | 12.1% | 14.0% |
| Standard Deviation (Population) | 12.0% | 13.8% |
Similar Demographics by Disability
Demographics Similar to Slavs by Disability
In terms of disability, the demographic groups most similar to Slavs are Canadian (12.4%, a difference of 0.060%), Immigrants from Liberia (12.4%, a difference of 0.090%), Immigrants from Laos (12.4%, a difference of 0.14%), Scandinavian (12.4%, a difference of 0.16%), and Immigrants from Dominica (12.4%, a difference of 0.23%).
| Demographics | Rating | Rank | Disability |
| Europeans | 1.4 /100 | #251 | Tragic 12.3% |
| Bermudans | 1.1 /100 | #252 | Tragic 12.3% |
| Belgians | 0.8 /100 | #253 | Tragic 12.3% |
| German Russians | 0.8 /100 | #254 | Tragic 12.3% |
| Slovenes | 0.6 /100 | #255 | Tragic 12.4% |
| Immigrants | Dominica | 0.6 /100 | #256 | Tragic 12.4% |
| Immigrants | Laos | 0.5 /100 | #257 | Tragic 12.4% |
| Slavs | 0.5 /100 | #258 | Tragic 12.4% |
| Canadians | 0.4 /100 | #259 | Tragic 12.4% |
| Immigrants | Liberia | 0.4 /100 | #260 | Tragic 12.4% |
| Scandinavians | 0.4 /100 | #261 | Tragic 12.4% |
| Native Hawaiians | 0.3 /100 | #262 | Tragic 12.5% |
| Hawaiians | 0.2 /100 | #263 | Tragic 12.5% |
| Immigrants | Germany | 0.2 /100 | #264 | Tragic 12.5% |
| U.S. Virgin Islanders | 0.2 /100 | #265 | Tragic 12.5% |
Demographics Similar to Immigrants from Ukraine by Disability
In terms of disability, the demographic groups most similar to Immigrants from Ukraine are Sudanese (11.5%, a difference of 0.030%), Immigrants from Hungary (11.5%, a difference of 0.090%), Nigerian (11.5%, a difference of 0.26%), Immigrants from Norway (11.6%, a difference of 0.27%), and Romanian (11.6%, a difference of 0.30%).
| Demographics | Rating | Rank | Disability |
| Russians | 86.8 /100 | #140 | Excellent 11.5% |
| Immigrants | Grenada | 86.1 /100 | #141 | Excellent 11.5% |
| Immigrants | Sudan | 85.3 /100 | #142 | Excellent 11.5% |
| Moroccans | 83.3 /100 | #143 | Excellent 11.5% |
| Australians | 82.5 /100 | #144 | Excellent 11.5% |
| Nigerians | 81.3 /100 | #145 | Excellent 11.5% |
| Immigrants | Hungary | 79.0 /100 | #146 | Good 11.5% |
| Immigrants | Ukraine | 77.6 /100 | #147 | Good 11.5% |
| Sudanese | 77.1 /100 | #148 | Good 11.5% |
| Immigrants | Norway | 73.2 /100 | #149 | Good 11.6% |
| Romanians | 72.7 /100 | #150 | Good 11.6% |
| Immigrants | Kenya | 72.1 /100 | #151 | Good 11.6% |
| Immigrants | Moldova | 72.0 /100 | #152 | Good 11.6% |
| Immigrants | Ghana | 71.2 /100 | #153 | Good 11.6% |
| Immigrants | Guatemala | 71.1 /100 | #154 | Good 11.6% |