Sioux vs Immigrants from Belarus Doctorate Degree
COMPARE
Sioux
Immigrants from Belarus
Doctorate Degree
Doctorate Degree Comparison
Sioux
Immigrants from Belarus
1.5%
DOCTORATE DEGREE
0.4/ 100
METRIC RATING
273rd/ 347
METRIC RANK
2.2%
DOCTORATE DEGREE
99.7/ 100
METRIC RATING
78th/ 347
METRIC RANK
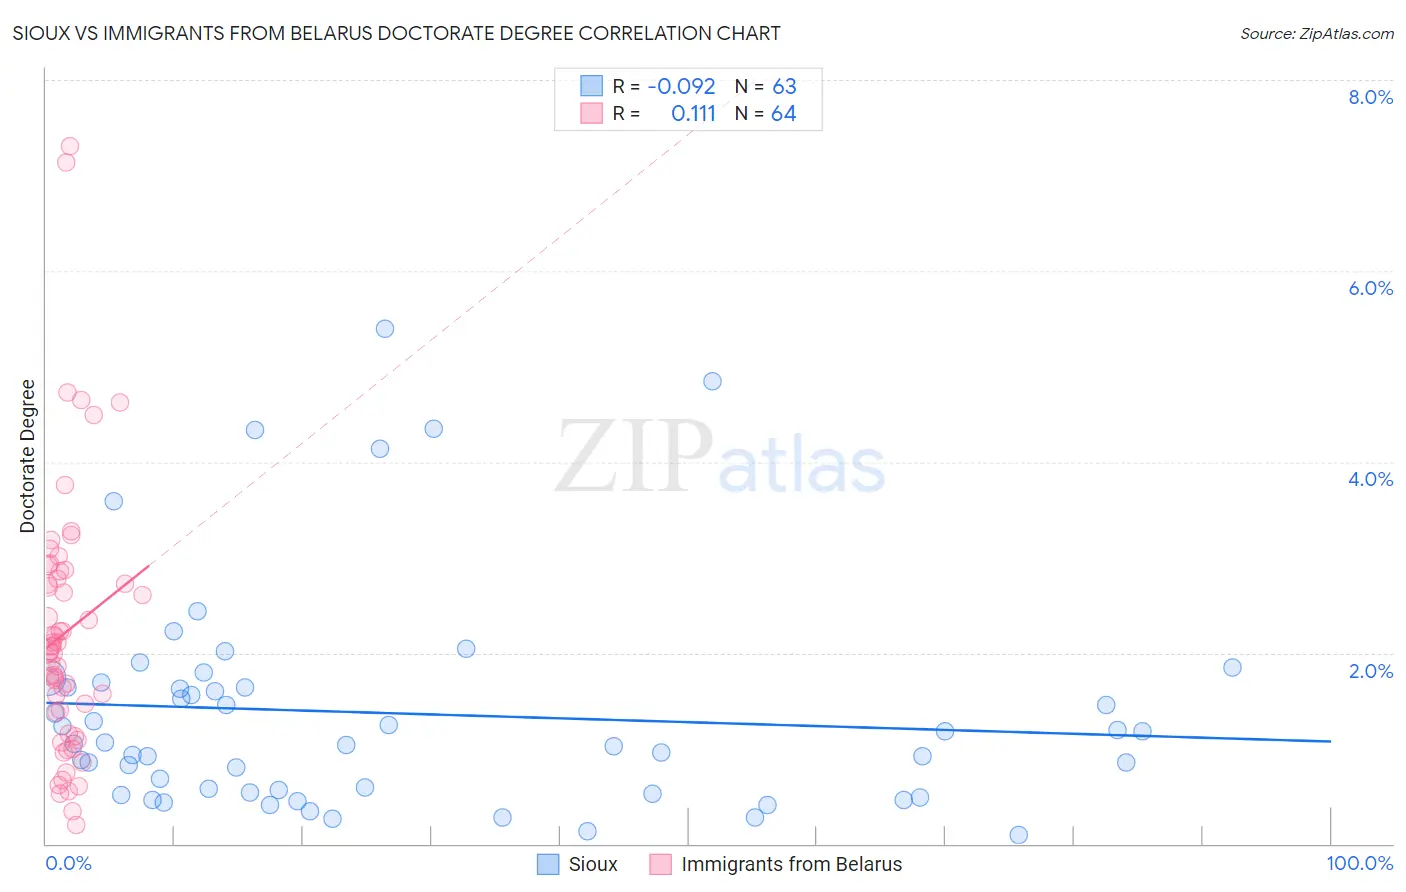
Sioux vs Immigrants from Belarus Doctorate Degree Correlation Chart
The statistical analysis conducted on geographies consisting of 231,042,673 people shows a slight negative correlation between the proportion of Sioux and percentage of population with at least doctorate degree education in the United States with a correlation coefficient (R) of -0.092 and weighted average of 1.5%. Similarly, the statistical analysis conducted on geographies consisting of 150,000,226 people shows a poor positive correlation between the proportion of Immigrants from Belarus and percentage of population with at least doctorate degree education in the United States with a correlation coefficient (R) of 0.111 and weighted average of 2.2%, a difference of 51.7%.
Doctorate Degree Correlation Summary
| Measurement | Sioux | Immigrants from Belarus |
| Minimum | 0.086% | 0.19% |
| Maximum | 5.4% | 7.3% |
| Range | 5.3% | 7.1% |
| Mean | 1.4% | 2.2% |
| Median | 1.1% | 2.0% |
| Interquartile 25% (IQ1) | 0.54% | 1.3% |
| Interquartile 75% (IQ3) | 1.6% | 2.8% |
| Interquartile Range (IQR) | 1.1% | 1.6% |
| Standard Deviation (Sample) | 1.2% | 1.4% |
| Standard Deviation (Population) | 1.2% | 1.4% |
Similar Demographics by Doctorate Degree
Demographics Similar to Sioux by Doctorate Degree
In terms of doctorate degree, the demographic groups most similar to Sioux are Yaqui (1.5%, a difference of 0.020%), Immigrants from Barbados (1.5%, a difference of 0.11%), Aleut (1.5%, a difference of 0.14%), Paiute (1.5%, a difference of 0.19%), and Immigrants from Trinidad and Tobago (1.5%, a difference of 0.20%).
| Demographics | Rating | Rank | Doctorate Degree |
| Immigrants | Liberia | 0.5 /100 | #266 | Tragic 1.5% |
| Kiowa | 0.5 /100 | #267 | Tragic 1.5% |
| U.S. Virgin Islanders | 0.5 /100 | #268 | Tragic 1.5% |
| Crow | 0.5 /100 | #269 | Tragic 1.5% |
| Salvadorans | 0.5 /100 | #270 | Tragic 1.5% |
| Immigrants | Trinidad and Tobago | 0.5 /100 | #271 | Tragic 1.5% |
| Immigrants | Barbados | 0.4 /100 | #272 | Tragic 1.5% |
| Sioux | 0.4 /100 | #273 | Tragic 1.5% |
| Yaqui | 0.4 /100 | #274 | Tragic 1.5% |
| Aleuts | 0.4 /100 | #275 | Tragic 1.5% |
| Paiute | 0.4 /100 | #276 | Tragic 1.5% |
| Bahamians | 0.4 /100 | #277 | Tragic 1.5% |
| Hawaiians | 0.4 /100 | #278 | Tragic 1.5% |
| Marshallese | 0.4 /100 | #279 | Tragic 1.5% |
| Ecuadorians | 0.4 /100 | #280 | Tragic 1.5% |
Demographics Similar to Immigrants from Belarus by Doctorate Degree
In terms of doctorate degree, the demographic groups most similar to Immigrants from Belarus are Northern European (2.2%, a difference of 0.070%), Ugandan (2.2%, a difference of 0.35%), Immigrants from Argentina (2.2%, a difference of 0.40%), Immigrants from Lebanon (2.2%, a difference of 0.52%), and Immigrants from Hungary (2.2%, a difference of 0.53%).
| Demographics | Rating | Rank | Doctorate Degree |
| Immigrants | Bolivia | 99.8 /100 | #71 | Exceptional 2.3% |
| Immigrants | Canada | 99.8 /100 | #72 | Exceptional 2.3% |
| Immigrants | Bulgaria | 99.8 /100 | #73 | Exceptional 2.3% |
| Immigrants | North America | 99.8 /100 | #74 | Exceptional 2.2% |
| Immigrants | Western Asia | 99.8 /100 | #75 | Exceptional 2.2% |
| Immigrants | Hungary | 99.8 /100 | #76 | Exceptional 2.2% |
| Immigrants | Lebanon | 99.8 /100 | #77 | Exceptional 2.2% |
| Immigrants | Belarus | 99.7 /100 | #78 | Exceptional 2.2% |
| Northern Europeans | 99.7 /100 | #79 | Exceptional 2.2% |
| Ugandans | 99.7 /100 | #80 | Exceptional 2.2% |
| Immigrants | Argentina | 99.7 /100 | #81 | Exceptional 2.2% |
| Immigrants | Uganda | 99.6 /100 | #82 | Exceptional 2.2% |
| Immigrants | Lithuania | 99.6 /100 | #83 | Exceptional 2.2% |
| Immigrants | England | 99.6 /100 | #84 | Exceptional 2.2% |
| Immigrants | Brazil | 99.6 /100 | #85 | Exceptional 2.2% |