Shoshone vs Immigrants from Grenada Disability
COMPARE
Shoshone
Immigrants from Grenada
Disability
Disability Comparison
Shoshone
Immigrants from Grenada
13.5%
DISABILITY
0.0/ 100
METRIC RATING
307th/ 347
METRIC RANK
11.5%
DISABILITY
86.1/ 100
METRIC RATING
141st/ 347
METRIC RANK
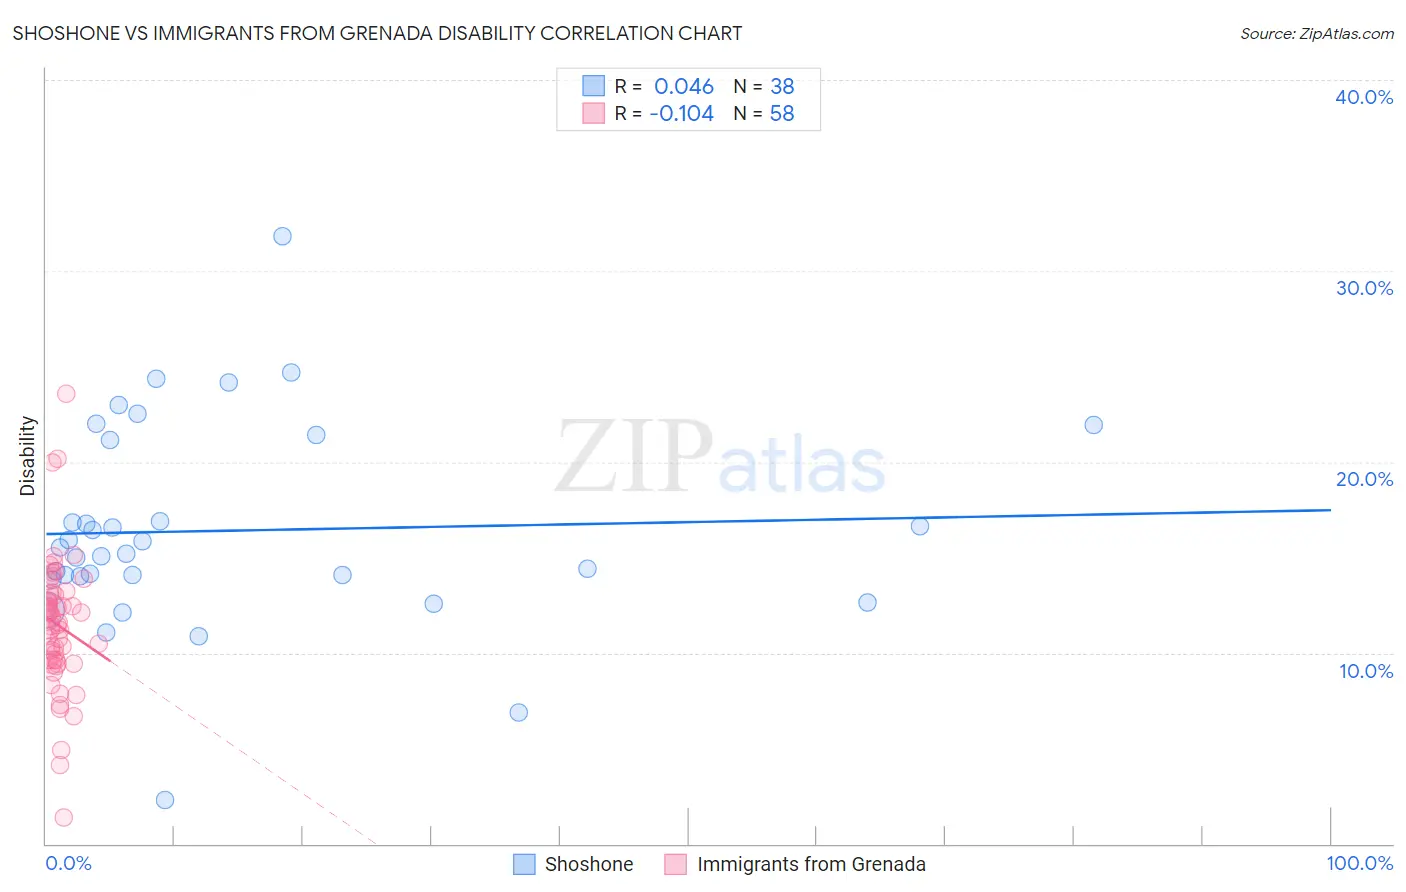
Shoshone vs Immigrants from Grenada Disability Correlation Chart
The statistical analysis conducted on geographies consisting of 66,619,944 people shows no correlation between the proportion of Shoshone and percentage of population with a disability in the United States with a correlation coefficient (R) of 0.046 and weighted average of 13.5%. Similarly, the statistical analysis conducted on geographies consisting of 67,198,924 people shows a poor negative correlation between the proportion of Immigrants from Grenada and percentage of population with a disability in the United States with a correlation coefficient (R) of -0.104 and weighted average of 11.5%, a difference of 17.9%.
Disability Correlation Summary
| Measurement | Shoshone | Immigrants from Grenada |
| Minimum | 2.3% | 1.4% |
| Maximum | 31.8% | 23.5% |
| Range | 29.5% | 22.2% |
| Mean | 16.4% | 11.5% |
| Median | 15.3% | 11.5% |
| Interquartile 25% (IQ1) | 14.0% | 9.6% |
| Interquartile 75% (IQ3) | 21.2% | 13.1% |
| Interquartile Range (IQR) | 7.1% | 3.5% |
| Standard Deviation (Sample) | 5.4% | 3.6% |
| Standard Deviation (Population) | 5.3% | 3.6% |
Similar Demographics by Disability
Demographics Similar to Shoshone by Disability
In terms of disability, the demographic groups most similar to Shoshone are Cape Verdean (13.5%, a difference of 0.050%), French American Indian (13.5%, a difference of 0.090%), Tlingit-Haida (13.5%, a difference of 0.18%), French Canadian (13.4%, a difference of 0.66%), and Blackfeet (13.6%, a difference of 0.71%).
| Demographics | Rating | Rank | Disability |
| Pennsylvania Germans | 0.0 /100 | #300 | Tragic 13.2% |
| Immigrants | Micronesia | 0.0 /100 | #301 | Tragic 13.2% |
| Arapaho | 0.0 /100 | #302 | Tragic 13.2% |
| Scotch-Irish | 0.0 /100 | #303 | Tragic 13.3% |
| Yakama | 0.0 /100 | #304 | Tragic 13.4% |
| French Canadians | 0.0 /100 | #305 | Tragic 13.4% |
| Cape Verdeans | 0.0 /100 | #306 | Tragic 13.5% |
| Shoshone | 0.0 /100 | #307 | Tragic 13.5% |
| French American Indians | 0.0 /100 | #308 | Tragic 13.5% |
| Tlingit-Haida | 0.0 /100 | #309 | Tragic 13.5% |
| Blackfeet | 0.0 /100 | #310 | Tragic 13.6% |
| Delaware | 0.0 /100 | #311 | Tragic 13.6% |
| Spanish Americans | 0.0 /100 | #312 | Tragic 13.6% |
| Cree | 0.0 /100 | #313 | Tragic 13.7% |
| Blacks/African Americans | 0.0 /100 | #314 | Tragic 13.7% |
Demographics Similar to Immigrants from Grenada by Disability
In terms of disability, the demographic groups most similar to Immigrants from Grenada are Russian (11.5%, a difference of 0.070%), Immigrants from Sudan (11.5%, a difference of 0.070%), Ghanaian (11.5%, a difference of 0.080%), New Zealander (11.5%, a difference of 0.090%), and Kenyan (11.5%, a difference of 0.10%).
| Demographics | Rating | Rank | Disability |
| Immigrants | Guyana | 88.3 /100 | #134 | Excellent 11.4% |
| Ugandans | 87.9 /100 | #135 | Excellent 11.4% |
| Immigrants | St. Vincent and the Grenadines | 87.8 /100 | #136 | Excellent 11.4% |
| Kenyans | 87.1 /100 | #137 | Excellent 11.5% |
| New Zealanders | 87.0 /100 | #138 | Excellent 11.5% |
| Ghanaians | 87.0 /100 | #139 | Excellent 11.5% |
| Russians | 86.8 /100 | #140 | Excellent 11.5% |
| Immigrants | Grenada | 86.1 /100 | #141 | Excellent 11.5% |
| Immigrants | Sudan | 85.3 /100 | #142 | Excellent 11.5% |
| Moroccans | 83.3 /100 | #143 | Excellent 11.5% |
| Australians | 82.5 /100 | #144 | Excellent 11.5% |
| Nigerians | 81.3 /100 | #145 | Excellent 11.5% |
| Immigrants | Hungary | 79.0 /100 | #146 | Good 11.5% |
| Immigrants | Ukraine | 77.6 /100 | #147 | Good 11.5% |
| Sudanese | 77.1 /100 | #148 | Good 11.5% |