Shoshone vs Immigrants from Grenada 10th Grade
COMPARE
Shoshone
Immigrants from Grenada
10th Grade
10th Grade Comparison
Shoshone
Immigrants from Grenada
94.2%
10TH GRADE
90.8/ 100
METRIC RATING
136th/ 347
METRIC RANK
91.6%
10TH GRADE
0.0/ 100
METRIC RATING
296th/ 347
METRIC RANK
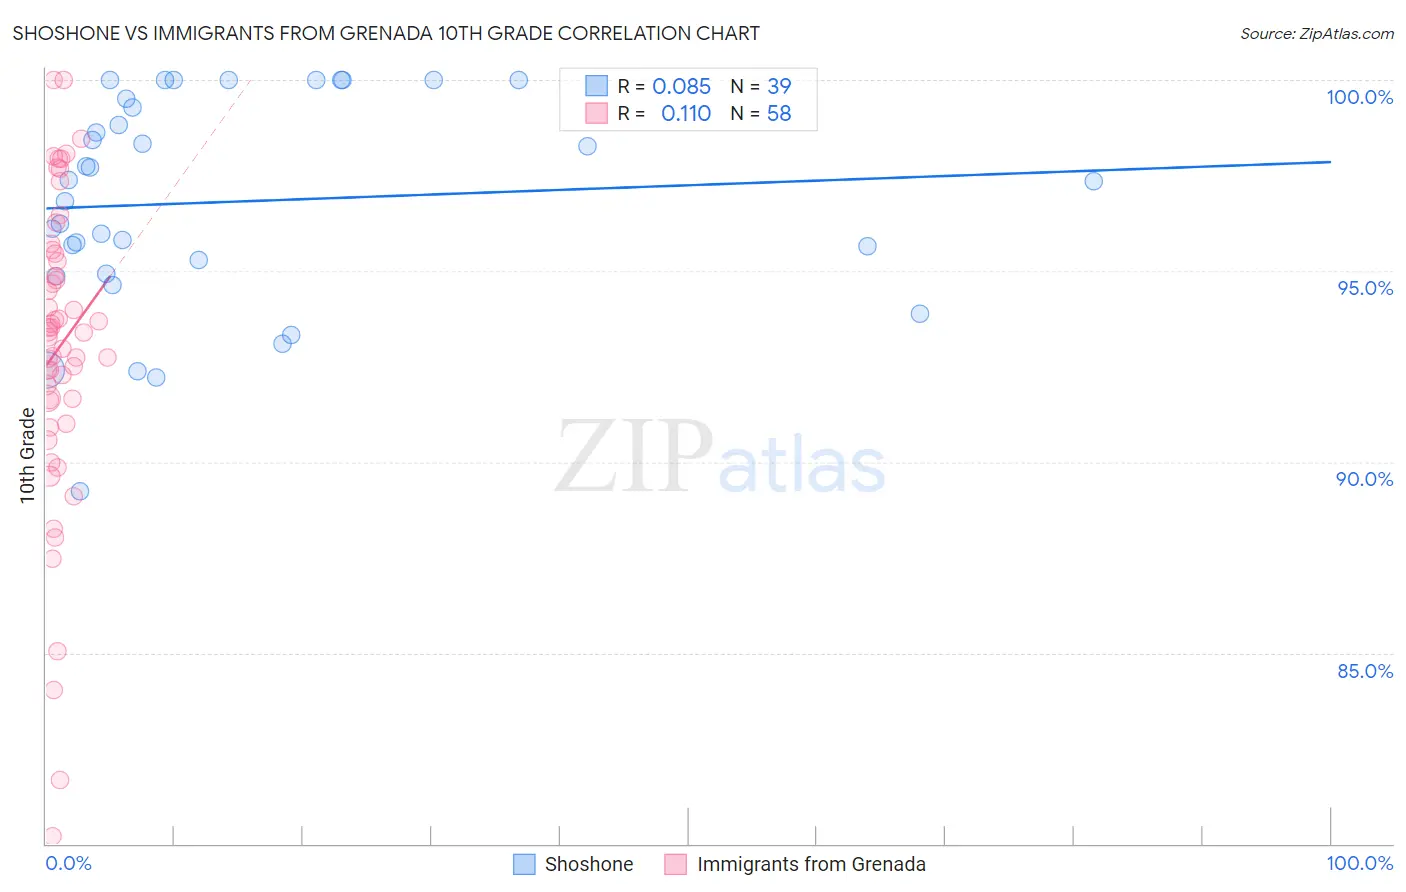
Shoshone vs Immigrants from Grenada 10th Grade Correlation Chart
The statistical analysis conducted on geographies consisting of 66,625,086 people shows a slight positive correlation between the proportion of Shoshone and percentage of population with at least 10th grade education in the United States with a correlation coefficient (R) of 0.085 and weighted average of 94.2%. Similarly, the statistical analysis conducted on geographies consisting of 67,199,790 people shows a poor positive correlation between the proportion of Immigrants from Grenada and percentage of population with at least 10th grade education in the United States with a correlation coefficient (R) of 0.110 and weighted average of 91.6%, a difference of 2.8%.
10th Grade Correlation Summary
| Measurement | Shoshone | Immigrants from Grenada |
| Minimum | 89.2% | 80.2% |
| Maximum | 100.0% | 100.0% |
| Range | 10.8% | 19.8% |
| Mean | 96.8% | 93.0% |
| Median | 97.3% | 93.4% |
| Interquartile 25% (IQ1) | 94.9% | 91.6% |
| Interquartile 75% (IQ3) | 99.5% | 95.4% |
| Interquartile Range (IQR) | 4.6% | 3.8% |
| Standard Deviation (Sample) | 2.8% | 4.1% |
| Standard Deviation (Population) | 2.7% | 4.0% |
Similar Demographics by 10th Grade
Demographics Similar to Shoshone by 10th Grade
In terms of 10th grade, the demographic groups most similar to Shoshone are Immigrants from Korea (94.2%, a difference of 0.010%), Arapaho (94.2%, a difference of 0.010%), Immigrants from Sri Lanka (94.2%, a difference of 0.020%), Creek (94.2%, a difference of 0.030%), and Osage (94.2%, a difference of 0.030%).
| Demographics | Rating | Rank | 10th Grade |
| Iroquois | 92.8 /100 | #129 | Exceptional 94.3% |
| Immigrants | Greece | 92.7 /100 | #130 | Exceptional 94.3% |
| Immigrants | Eastern Europe | 92.5 /100 | #131 | Exceptional 94.3% |
| Immigrants | Russia | 92.4 /100 | #132 | Exceptional 94.3% |
| Creek | 91.9 /100 | #133 | Exceptional 94.2% |
| Osage | 91.7 /100 | #134 | Exceptional 94.2% |
| Immigrants | Korea | 91.3 /100 | #135 | Exceptional 94.2% |
| Shoshone | 90.8 /100 | #136 | Exceptional 94.2% |
| Arapaho | 90.5 /100 | #137 | Exceptional 94.2% |
| Immigrants | Sri Lanka | 89.9 /100 | #138 | Excellent 94.2% |
| Immigrants | Bosnia and Herzegovina | 89.4 /100 | #139 | Excellent 94.2% |
| Immigrants | Jordan | 87.6 /100 | #140 | Excellent 94.1% |
| Hmong | 86.6 /100 | #141 | Excellent 94.1% |
| Albanians | 86.5 /100 | #142 | Excellent 94.1% |
| Cherokee | 84.9 /100 | #143 | Excellent 94.1% |
Demographics Similar to Immigrants from Grenada by 10th Grade
In terms of 10th grade, the demographic groups most similar to Immigrants from Grenada are Lumbee (91.7%, a difference of 0.13%), Fijian (91.5%, a difference of 0.14%), Haitian (91.8%, a difference of 0.15%), Cuban (91.5%, a difference of 0.17%), and Indonesian (91.8%, a difference of 0.19%).
| Demographics | Rating | Rank | 10th Grade |
| Sri Lankans | 0.0 /100 | #289 | Tragic 91.8% |
| British West Indians | 0.0 /100 | #290 | Tragic 91.8% |
| Immigrants | West Indies | 0.0 /100 | #291 | Tragic 91.8% |
| Immigrants | Burma/Myanmar | 0.0 /100 | #292 | Tragic 91.8% |
| Indonesians | 0.0 /100 | #293 | Tragic 91.8% |
| Haitians | 0.0 /100 | #294 | Tragic 91.8% |
| Lumbee | 0.0 /100 | #295 | Tragic 91.7% |
| Immigrants | Grenada | 0.0 /100 | #296 | Tragic 91.6% |
| Fijians | 0.0 /100 | #297 | Tragic 91.5% |
| Cubans | 0.0 /100 | #298 | Tragic 91.5% |
| Immigrants | Haiti | 0.0 /100 | #299 | Tragic 91.4% |
| Guyanese | 0.0 /100 | #300 | Tragic 91.4% |
| Japanese | 0.0 /100 | #301 | Tragic 91.2% |
| Immigrants | Guyana | 0.0 /100 | #302 | Tragic 91.2% |
| Immigrants | Vietnam | 0.0 /100 | #303 | Tragic 91.2% |