Shoshone vs Immigrants from Grenada In Labor Force | Age 45-54
COMPARE
Shoshone
Immigrants from Grenada
In Labor Force | Age 45-54
In Labor Force | Age 45-54 Comparison
Shoshone
Immigrants from Grenada
79.3%
IN LABOR FORCE | AGE 45-54
0.0/ 100
METRIC RATING
316th/ 347
METRIC RANK
81.0%
IN LABOR FORCE | AGE 45-54
0.0/ 100
METRIC RATING
281st/ 347
METRIC RANK
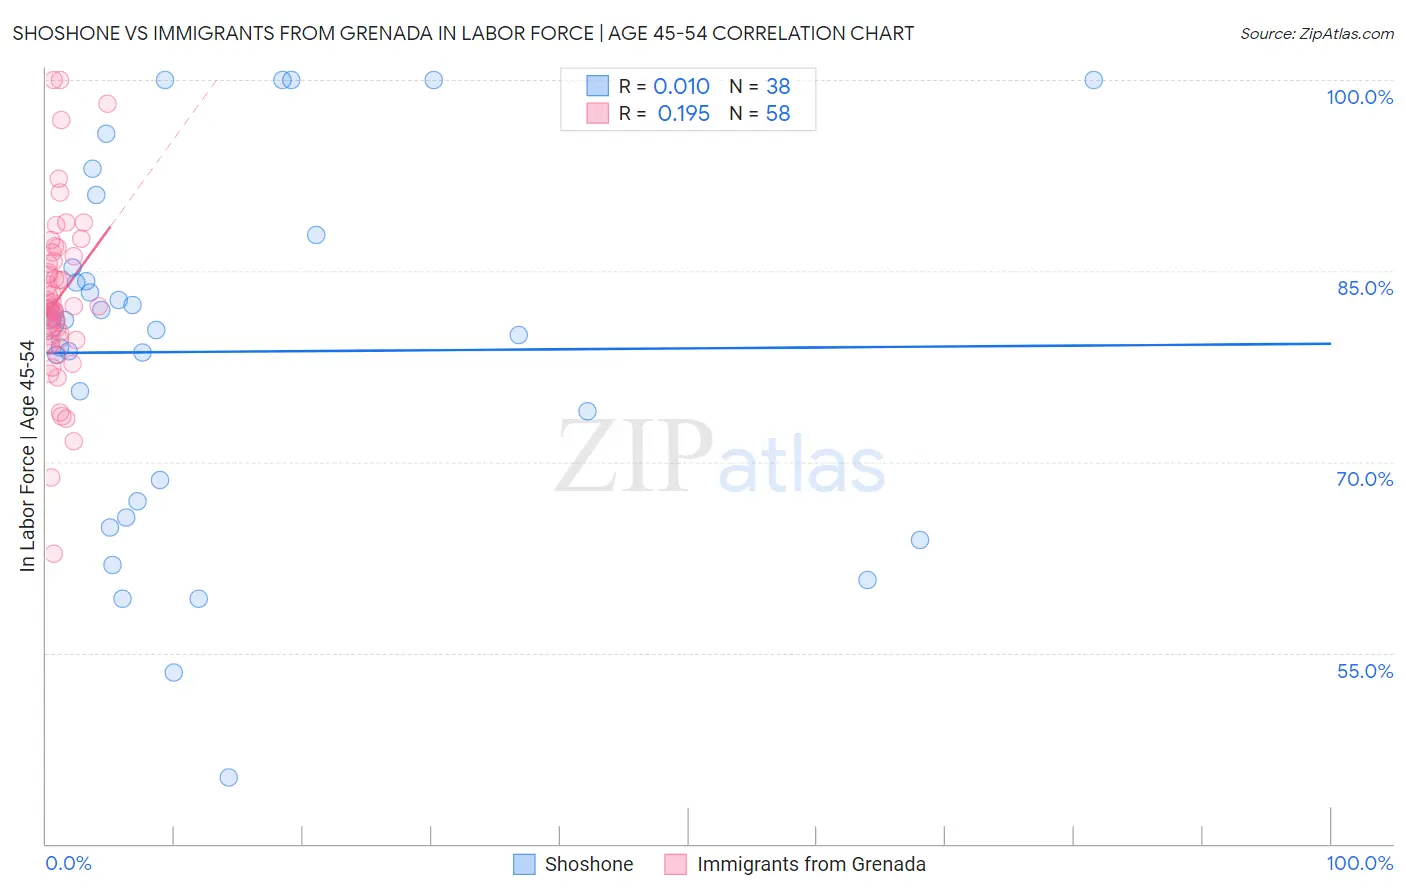
Shoshone vs Immigrants from Grenada In Labor Force | Age 45-54 Correlation Chart
The statistical analysis conducted on geographies consisting of 66,619,718 people shows no correlation between the proportion of Shoshone and labor force participation rate among population between the ages 45 and 54 in the United States with a correlation coefficient (R) of 0.010 and weighted average of 79.3%. Similarly, the statistical analysis conducted on geographies consisting of 67,184,944 people shows a poor positive correlation between the proportion of Immigrants from Grenada and labor force participation rate among population between the ages 45 and 54 in the United States with a correlation coefficient (R) of 0.195 and weighted average of 81.0%, a difference of 2.2%.
In Labor Force | Age 45-54 Correlation Summary
| Measurement | Shoshone | Immigrants from Grenada |
| Minimum | 45.2% | 62.8% |
| Maximum | 100.0% | 100.0% |
| Range | 54.8% | 37.2% |
| Mean | 78.7% | 82.9% |
| Median | 80.7% | 82.2% |
| Interquartile 25% (IQ1) | 66.9% | 79.7% |
| Interquartile 75% (IQ3) | 85.3% | 86.2% |
| Interquartile Range (IQR) | 18.4% | 6.5% |
| Standard Deviation (Sample) | 13.9% | 6.8% |
| Standard Deviation (Population) | 13.7% | 6.7% |
Similar Demographics by In Labor Force | Age 45-54
Demographics Similar to Shoshone by In Labor Force | Age 45-54
In terms of in labor force | age 45-54, the demographic groups most similar to Shoshone are Black/African American (79.3%, a difference of 0.080%), Comanche (79.2%, a difference of 0.13%), Ottawa (79.5%, a difference of 0.22%), Colville (79.5%, a difference of 0.26%), and Chickasaw (79.0%, a difference of 0.31%).
| Demographics | Rating | Rank | In Labor Force | Age 45-54 |
| Potawatomi | 0.0 /100 | #309 | Tragic 80.0% |
| Inupiat | 0.0 /100 | #310 | Tragic 79.9% |
| Mexicans | 0.0 /100 | #311 | Tragic 79.8% |
| Immigrants | Mexico | 0.0 /100 | #312 | Tragic 79.7% |
| Colville | 0.0 /100 | #313 | Tragic 79.5% |
| Ottawa | 0.0 /100 | #314 | Tragic 79.5% |
| Blacks/African Americans | 0.0 /100 | #315 | Tragic 79.3% |
| Shoshone | 0.0 /100 | #316 | Tragic 79.3% |
| Comanche | 0.0 /100 | #317 | Tragic 79.2% |
| Chickasaw | 0.0 /100 | #318 | Tragic 79.0% |
| Cherokee | 0.0 /100 | #319 | Tragic 79.0% |
| Yaqui | 0.0 /100 | #320 | Tragic 78.9% |
| Yup'ik | 0.0 /100 | #321 | Tragic 78.6% |
| Crow | 0.0 /100 | #322 | Tragic 78.3% |
| Kiowa | 0.0 /100 | #323 | Tragic 78.3% |
Demographics Similar to Immigrants from Grenada by In Labor Force | Age 45-54
In terms of in labor force | age 45-54, the demographic groups most similar to Immigrants from Grenada are Immigrants from Latin America (81.0%, a difference of 0.0%), Aleut (81.0%, a difference of 0.070%), Immigrants from Micronesia (81.1%, a difference of 0.11%), Immigrants from Guatemala (81.1%, a difference of 0.12%), and Guatemalan (81.2%, a difference of 0.20%).
| Demographics | Rating | Rank | In Labor Force | Age 45-54 |
| British West Indians | 0.0 /100 | #274 | Tragic 81.2% |
| Immigrants | Nonimmigrants | 0.0 /100 | #275 | Tragic 81.2% |
| U.S. Virgin Islanders | 0.0 /100 | #276 | Tragic 81.2% |
| Guatemalans | 0.0 /100 | #277 | Tragic 81.2% |
| Immigrants | Guatemala | 0.0 /100 | #278 | Tragic 81.1% |
| Immigrants | Micronesia | 0.0 /100 | #279 | Tragic 81.1% |
| Immigrants | Latin America | 0.0 /100 | #280 | Tragic 81.0% |
| Immigrants | Grenada | 0.0 /100 | #281 | Tragic 81.0% |
| Aleuts | 0.0 /100 | #282 | Tragic 81.0% |
| French American Indians | 0.0 /100 | #283 | Tragic 80.8% |
| Belizeans | 0.0 /100 | #284 | Tragic 80.8% |
| Delaware | 0.0 /100 | #285 | Tragic 80.8% |
| Immigrants | Dominica | 0.0 /100 | #286 | Tragic 80.8% |
| Vietnamese | 0.0 /100 | #287 | Tragic 80.8% |
| Cree | 0.0 /100 | #288 | Tragic 80.8% |