Shoshone vs Immigrants from Croatia Disability
COMPARE
Shoshone
Immigrants from Croatia
Disability
Disability Comparison
Shoshone
Immigrants from Croatia
13.5%
DISABILITY
0.0/ 100
METRIC RATING
307th/ 347
METRIC RANK
11.4%
DISABILITY
89.8/ 100
METRIC RATING
131st/ 347
METRIC RANK
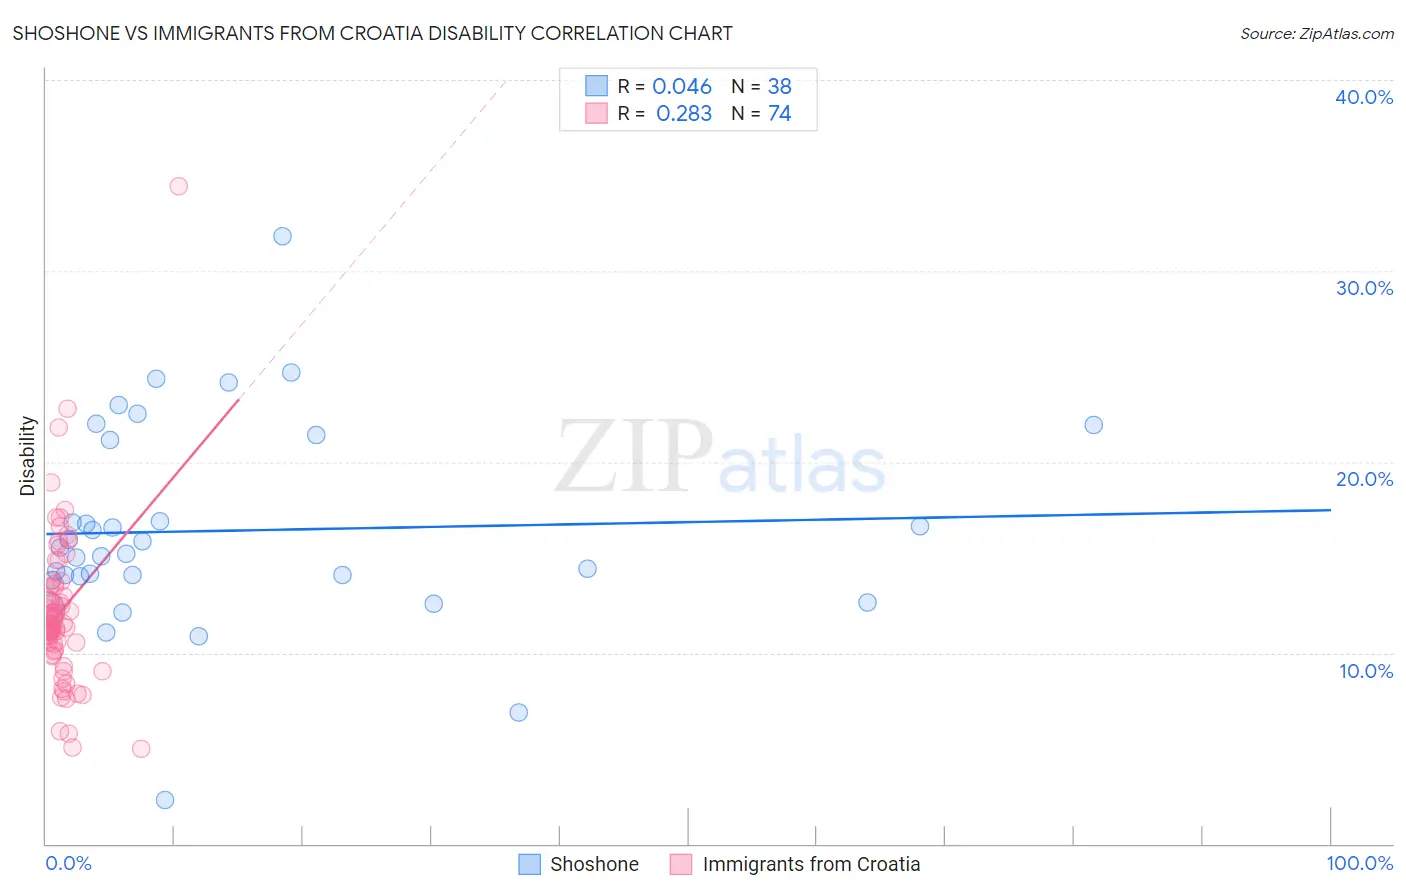
Shoshone vs Immigrants from Croatia Disability Correlation Chart
The statistical analysis conducted on geographies consisting of 66,619,944 people shows no correlation between the proportion of Shoshone and percentage of population with a disability in the United States with a correlation coefficient (R) of 0.046 and weighted average of 13.5%. Similarly, the statistical analysis conducted on geographies consisting of 132,571,649 people shows a weak positive correlation between the proportion of Immigrants from Croatia and percentage of population with a disability in the United States with a correlation coefficient (R) of 0.283 and weighted average of 11.4%, a difference of 18.3%.
Disability Correlation Summary
| Measurement | Shoshone | Immigrants from Croatia |
| Minimum | 2.3% | 5.0% |
| Maximum | 31.8% | 34.4% |
| Range | 29.5% | 29.5% |
| Mean | 16.4% | 12.2% |
| Median | 15.3% | 11.5% |
| Interquartile 25% (IQ1) | 14.0% | 10.1% |
| Interquartile 75% (IQ3) | 21.2% | 13.5% |
| Interquartile Range (IQR) | 7.1% | 3.4% |
| Standard Deviation (Sample) | 5.4% | 4.3% |
| Standard Deviation (Population) | 5.3% | 4.2% |
Similar Demographics by Disability
Demographics Similar to Shoshone by Disability
In terms of disability, the demographic groups most similar to Shoshone are Cape Verdean (13.5%, a difference of 0.050%), French American Indian (13.5%, a difference of 0.090%), Tlingit-Haida (13.5%, a difference of 0.18%), French Canadian (13.4%, a difference of 0.66%), and Blackfeet (13.6%, a difference of 0.71%).
| Demographics | Rating | Rank | Disability |
| Pennsylvania Germans | 0.0 /100 | #300 | Tragic 13.2% |
| Immigrants | Micronesia | 0.0 /100 | #301 | Tragic 13.2% |
| Arapaho | 0.0 /100 | #302 | Tragic 13.2% |
| Scotch-Irish | 0.0 /100 | #303 | Tragic 13.3% |
| Yakama | 0.0 /100 | #304 | Tragic 13.4% |
| French Canadians | 0.0 /100 | #305 | Tragic 13.4% |
| Cape Verdeans | 0.0 /100 | #306 | Tragic 13.5% |
| Shoshone | 0.0 /100 | #307 | Tragic 13.5% |
| French American Indians | 0.0 /100 | #308 | Tragic 13.5% |
| Tlingit-Haida | 0.0 /100 | #309 | Tragic 13.5% |
| Blackfeet | 0.0 /100 | #310 | Tragic 13.6% |
| Delaware | 0.0 /100 | #311 | Tragic 13.6% |
| Spanish Americans | 0.0 /100 | #312 | Tragic 13.6% |
| Cree | 0.0 /100 | #313 | Tragic 13.7% |
| Blacks/African Americans | 0.0 /100 | #314 | Tragic 13.7% |
Demographics Similar to Immigrants from Croatia by Disability
In terms of disability, the demographic groups most similar to Immigrants from Croatia are Latvian (11.4%, a difference of 0.010%), Macedonian (11.4%, a difference of 0.060%), Immigrants from Africa (11.4%, a difference of 0.060%), Immigrants from Italy (11.4%, a difference of 0.080%), and Immigrants from Europe (11.4%, a difference of 0.080%).
| Demographics | Rating | Rank | Disability |
| South American Indians | 92.2 /100 | #124 | Exceptional 11.4% |
| Costa Ricans | 91.9 /100 | #125 | Exceptional 11.4% |
| Immigrants | Latvia | 90.9 /100 | #126 | Exceptional 11.4% |
| Immigrants | Italy | 90.4 /100 | #127 | Exceptional 11.4% |
| Immigrants | Europe | 90.4 /100 | #128 | Exceptional 11.4% |
| Macedonians | 90.3 /100 | #129 | Exceptional 11.4% |
| Latvians | 89.8 /100 | #130 | Excellent 11.4% |
| Immigrants | Croatia | 89.8 /100 | #131 | Excellent 11.4% |
| Immigrants | Africa | 89.3 /100 | #132 | Excellent 11.4% |
| Arabs | 89.1 /100 | #133 | Excellent 11.4% |
| Immigrants | Guyana | 88.3 /100 | #134 | Excellent 11.4% |
| Ugandans | 87.9 /100 | #135 | Excellent 11.4% |
| Immigrants | St. Vincent and the Grenadines | 87.8 /100 | #136 | Excellent 11.4% |
| Kenyans | 87.1 /100 | #137 | Excellent 11.5% |
| New Zealanders | 87.0 /100 | #138 | Excellent 11.5% |