Shoshone vs Tohono O'odham Disability
COMPARE
Shoshone
Tohono O'odham
Disability
Disability Comparison
Shoshone
Tohono O'odham
13.5%
DISABILITY
0.0/ 100
METRIC RATING
307th/ 347
METRIC RANK
14.8%
DISABILITY
0.0/ 100
METRIC RATING
335th/ 347
METRIC RANK
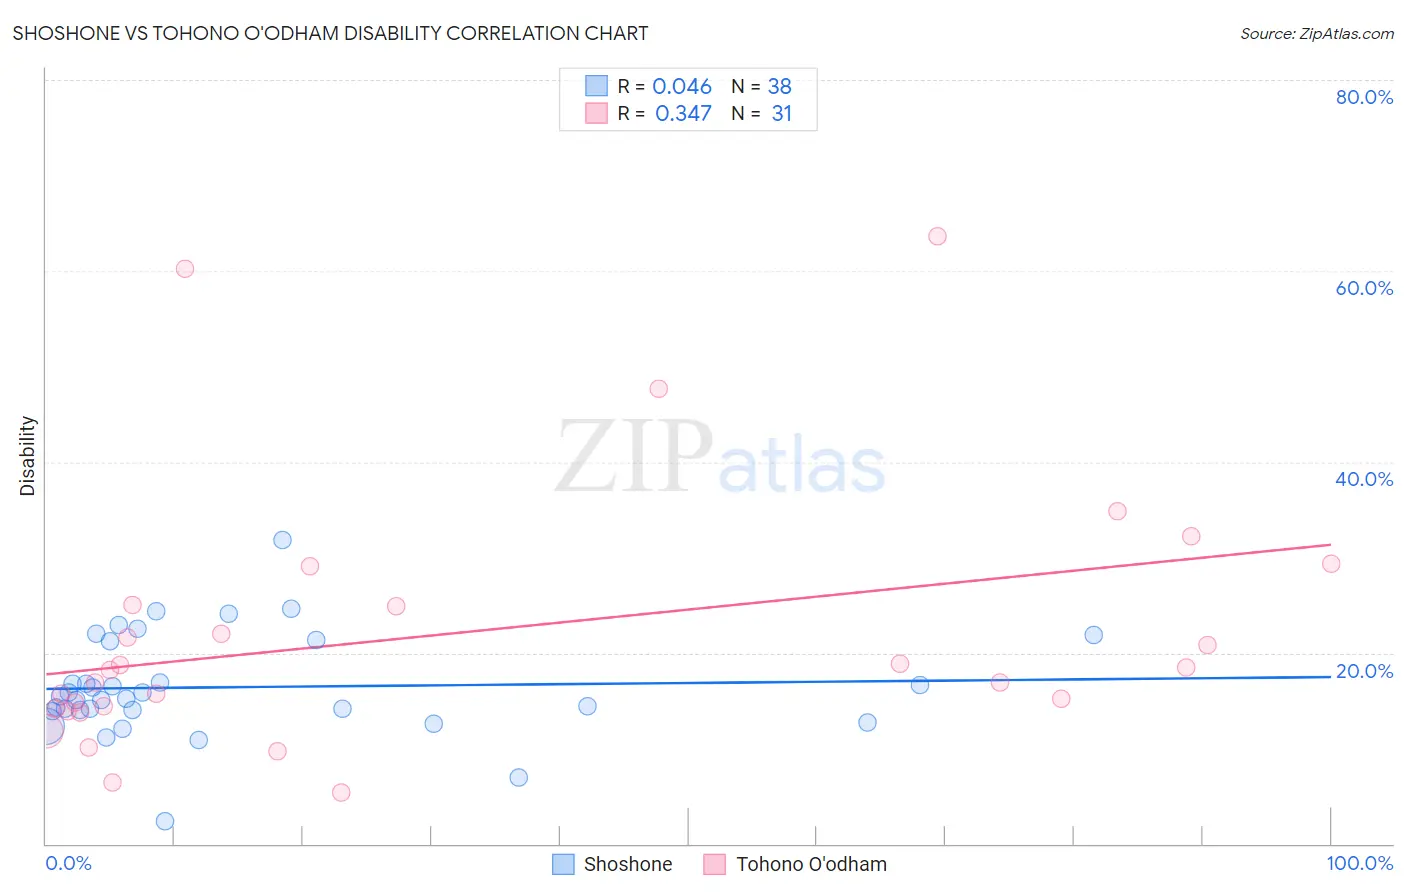
Shoshone vs Tohono O'odham Disability Correlation Chart
The statistical analysis conducted on geographies consisting of 66,619,944 people shows no correlation between the proportion of Shoshone and percentage of population with a disability in the United States with a correlation coefficient (R) of 0.046 and weighted average of 13.5%. Similarly, the statistical analysis conducted on geographies consisting of 58,721,793 people shows a mild positive correlation between the proportion of Tohono O'odham and percentage of population with a disability in the United States with a correlation coefficient (R) of 0.347 and weighted average of 14.8%, a difference of 9.3%.
Disability Correlation Summary
| Measurement | Shoshone | Tohono O'odham |
| Minimum | 2.3% | 5.4% |
| Maximum | 31.8% | 63.6% |
| Range | 29.5% | 58.3% |
| Mean | 16.4% | 21.9% |
| Median | 15.3% | 18.2% |
| Interquartile 25% (IQ1) | 14.0% | 14.1% |
| Interquartile 75% (IQ3) | 21.2% | 25.0% |
| Interquartile Range (IQR) | 7.1% | 10.9% |
| Standard Deviation (Sample) | 5.4% | 13.8% |
| Standard Deviation (Population) | 5.3% | 13.5% |
Similar Demographics by Disability
Demographics Similar to Shoshone by Disability
In terms of disability, the demographic groups most similar to Shoshone are Cape Verdean (13.5%, a difference of 0.050%), French American Indian (13.5%, a difference of 0.090%), Tlingit-Haida (13.5%, a difference of 0.18%), French Canadian (13.4%, a difference of 0.66%), and Blackfeet (13.6%, a difference of 0.71%).
| Demographics | Rating | Rank | Disability |
| Pennsylvania Germans | 0.0 /100 | #300 | Tragic 13.2% |
| Immigrants | Micronesia | 0.0 /100 | #301 | Tragic 13.2% |
| Arapaho | 0.0 /100 | #302 | Tragic 13.2% |
| Scotch-Irish | 0.0 /100 | #303 | Tragic 13.3% |
| Yakama | 0.0 /100 | #304 | Tragic 13.4% |
| French Canadians | 0.0 /100 | #305 | Tragic 13.4% |
| Cape Verdeans | 0.0 /100 | #306 | Tragic 13.5% |
| Shoshone | 0.0 /100 | #307 | Tragic 13.5% |
| French American Indians | 0.0 /100 | #308 | Tragic 13.5% |
| Tlingit-Haida | 0.0 /100 | #309 | Tragic 13.5% |
| Blackfeet | 0.0 /100 | #310 | Tragic 13.6% |
| Delaware | 0.0 /100 | #311 | Tragic 13.6% |
| Spanish Americans | 0.0 /100 | #312 | Tragic 13.6% |
| Cree | 0.0 /100 | #313 | Tragic 13.7% |
| Blacks/African Americans | 0.0 /100 | #314 | Tragic 13.7% |
Demographics Similar to Tohono O'odham by Disability
In terms of disability, the demographic groups most similar to Tohono O'odham are Cherokee (14.8%, a difference of 0.51%), Seminole (14.9%, a difference of 0.61%), Dutch West Indian (14.9%, a difference of 0.91%), Yuman (14.6%, a difference of 1.0%), and Cajun (14.6%, a difference of 1.2%).
| Demographics | Rating | Rank | Disability |
| Immigrants | Azores | 0.0 /100 | #328 | Tragic 14.2% |
| Potawatomi | 0.0 /100 | #329 | Tragic 14.2% |
| Navajo | 0.0 /100 | #330 | Tragic 14.3% |
| Alaskan Athabascans | 0.0 /100 | #331 | Tragic 14.4% |
| Pueblo | 0.0 /100 | #332 | Tragic 14.4% |
| Cajuns | 0.0 /100 | #333 | Tragic 14.6% |
| Yuman | 0.0 /100 | #334 | Tragic 14.6% |
| Tohono O'odham | 0.0 /100 | #335 | Tragic 14.8% |
| Cherokee | 0.0 /100 | #336 | Tragic 14.8% |
| Seminole | 0.0 /100 | #337 | Tragic 14.9% |
| Dutch West Indians | 0.0 /100 | #338 | Tragic 14.9% |
| Chickasaw | 0.0 /100 | #339 | Tragic 15.2% |
| Choctaw | 0.0 /100 | #340 | Tragic 15.4% |
| Lumbee | 0.0 /100 | #341 | Tragic 15.5% |
| Kiowa | 0.0 /100 | #342 | Tragic 15.6% |