Arab vs Immigrants from Grenada Disability
COMPARE
Arab
Immigrants from Grenada
Disability
Disability Comparison
Arabs
Immigrants from Grenada
11.4%
DISABILITY
89.1/ 100
METRIC RATING
133rd/ 347
METRIC RANK
11.5%
DISABILITY
86.1/ 100
METRIC RATING
141st/ 347
METRIC RANK
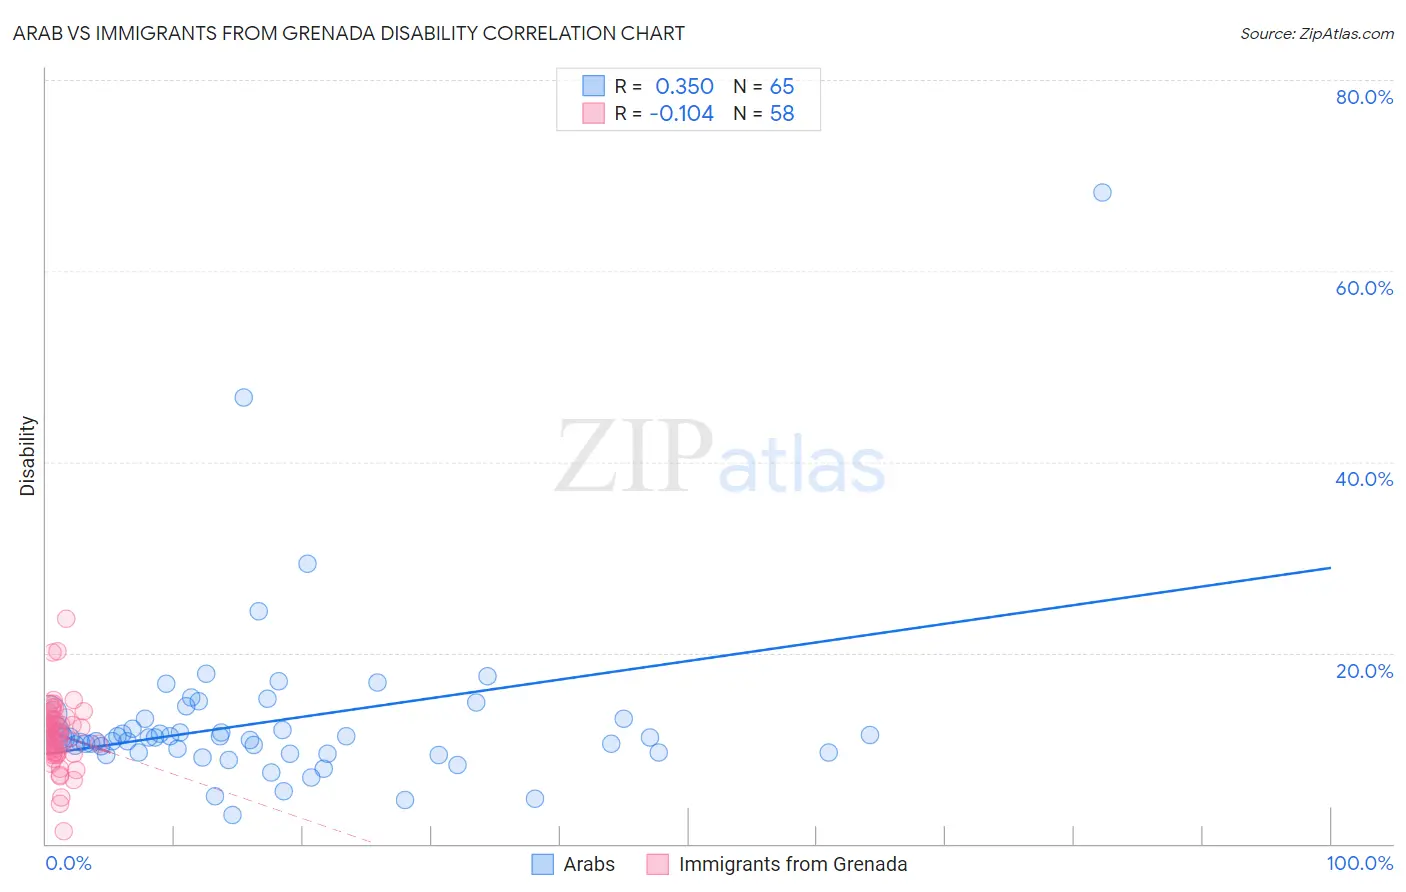
Arab vs Immigrants from Grenada Disability Correlation Chart
The statistical analysis conducted on geographies consisting of 486,795,543 people shows a mild positive correlation between the proportion of Arabs and percentage of population with a disability in the United States with a correlation coefficient (R) of 0.350 and weighted average of 11.4%. Similarly, the statistical analysis conducted on geographies consisting of 67,198,924 people shows a poor negative correlation between the proportion of Immigrants from Grenada and percentage of population with a disability in the United States with a correlation coefficient (R) of -0.104 and weighted average of 11.5%, a difference of 0.31%.
Disability Correlation Summary
| Measurement | Arab | Immigrants from Grenada |
| Minimum | 3.0% | 1.4% |
| Maximum | 68.2% | 23.5% |
| Range | 65.2% | 22.2% |
| Mean | 12.9% | 11.5% |
| Median | 11.1% | 11.5% |
| Interquartile 25% (IQ1) | 9.6% | 9.6% |
| Interquartile 75% (IQ3) | 13.1% | 13.1% |
| Interquartile Range (IQR) | 3.5% | 3.5% |
| Standard Deviation (Sample) | 9.2% | 3.6% |
| Standard Deviation (Population) | 9.1% | 3.6% |
Demographics Similar to Arabs and Immigrants from Grenada by Disability
In terms of disability, the demographic groups most similar to Arabs are Immigrants from Africa (11.4%, a difference of 0.030%), Immigrants from Croatia (11.4%, a difference of 0.080%), Immigrants from Guyana (11.4%, a difference of 0.080%), Latvian (11.4%, a difference of 0.090%), and Ugandan (11.4%, a difference of 0.13%). Similarly, the demographic groups most similar to Immigrants from Grenada are Russian (11.5%, a difference of 0.070%), Immigrants from Sudan (11.5%, a difference of 0.070%), Ghanaian (11.5%, a difference of 0.080%), New Zealander (11.5%, a difference of 0.090%), and Kenyan (11.5%, a difference of 0.10%).
| Demographics | Rating | Rank | Disability |
| Immigrants | Italy | 90.4 /100 | #127 | Exceptional 11.4% |
| Immigrants | Europe | 90.4 /100 | #128 | Exceptional 11.4% |
| Macedonians | 90.3 /100 | #129 | Exceptional 11.4% |
| Latvians | 89.8 /100 | #130 | Excellent 11.4% |
| Immigrants | Croatia | 89.8 /100 | #131 | Excellent 11.4% |
| Immigrants | Africa | 89.3 /100 | #132 | Excellent 11.4% |
| Arabs | 89.1 /100 | #133 | Excellent 11.4% |
| Immigrants | Guyana | 88.3 /100 | #134 | Excellent 11.4% |
| Ugandans | 87.9 /100 | #135 | Excellent 11.4% |
| Immigrants | St. Vincent and the Grenadines | 87.8 /100 | #136 | Excellent 11.4% |
| Kenyans | 87.1 /100 | #137 | Excellent 11.5% |
| New Zealanders | 87.0 /100 | #138 | Excellent 11.5% |
| Ghanaians | 87.0 /100 | #139 | Excellent 11.5% |
| Russians | 86.8 /100 | #140 | Excellent 11.5% |
| Immigrants | Grenada | 86.1 /100 | #141 | Excellent 11.5% |
| Immigrants | Sudan | 85.3 /100 | #142 | Excellent 11.5% |
| Moroccans | 83.3 /100 | #143 | Excellent 11.5% |
| Australians | 82.5 /100 | #144 | Excellent 11.5% |
| Nigerians | 81.3 /100 | #145 | Excellent 11.5% |
| Immigrants | Hungary | 79.0 /100 | #146 | Good 11.5% |
| Immigrants | Ukraine | 77.6 /100 | #147 | Good 11.5% |