Shoshone vs Immigrants from Grenada Unemployment Among Ages 20 to 24 years
COMPARE
Shoshone
Immigrants from Grenada
Unemployment Among Ages 20 to 24 years
Unemployment Among Ages 20 to 24 years Comparison
Shoshone
Immigrants from Grenada
12.7%
UNEMPLOYMENT AMONG AGES 20 TO 24 YEARS
0.0/ 100
METRIC RATING
313th/ 347
METRIC RANK
13.8%
UNEMPLOYMENT AMONG AGES 20 TO 24 YEARS
0.0/ 100
METRIC RATING
332nd/ 347
METRIC RANK
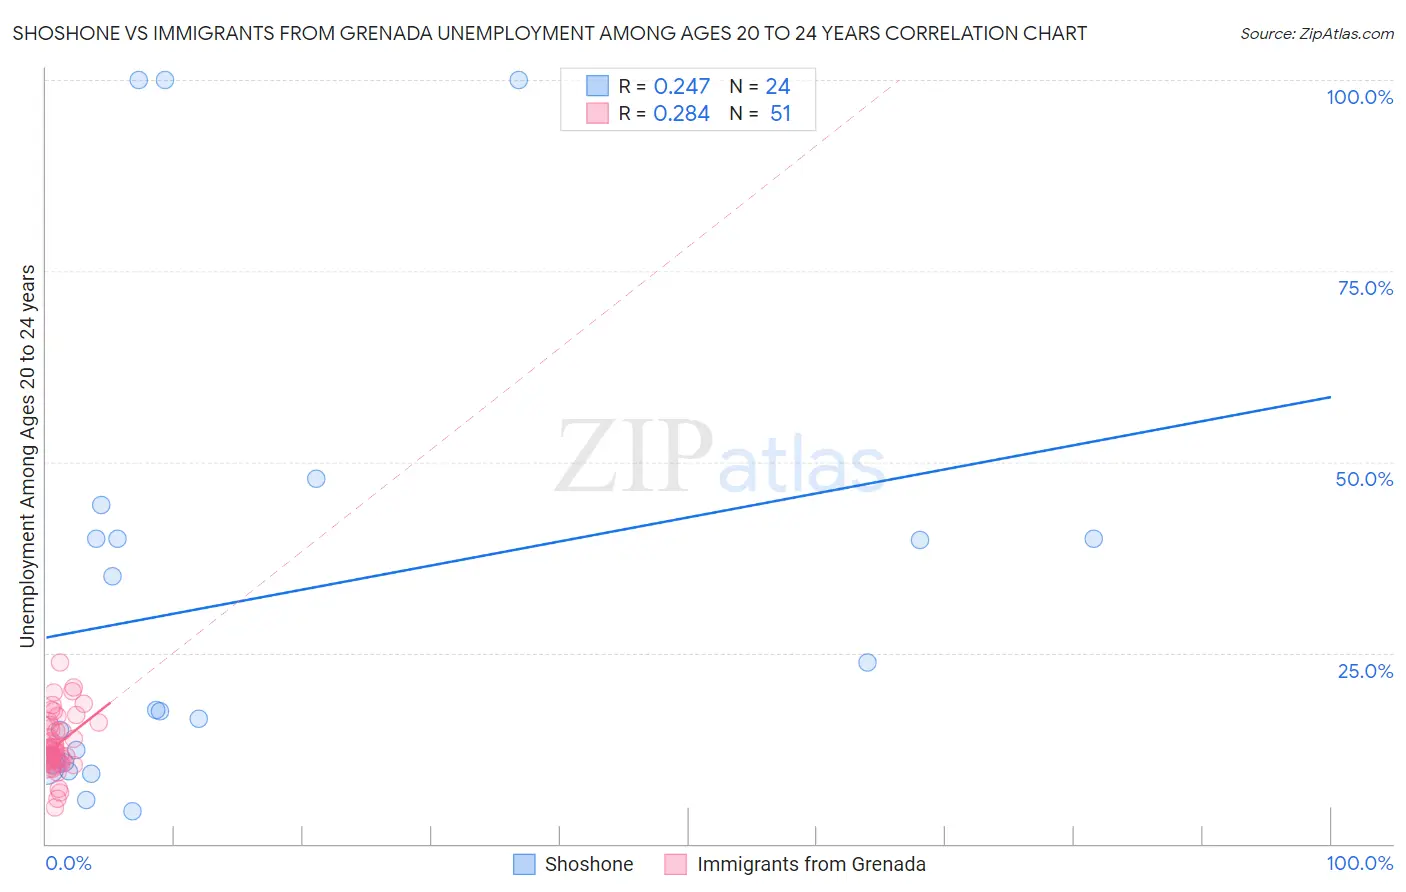
Shoshone vs Immigrants from Grenada Unemployment Among Ages 20 to 24 years Correlation Chart
The statistical analysis conducted on geographies consisting of 65,930,341 people shows a weak positive correlation between the proportion of Shoshone and unemployment rate among population between the ages 20 and 24 in the United States with a correlation coefficient (R) of 0.247 and weighted average of 12.7%. Similarly, the statistical analysis conducted on geographies consisting of 66,877,334 people shows a weak positive correlation between the proportion of Immigrants from Grenada and unemployment rate among population between the ages 20 and 24 in the United States with a correlation coefficient (R) of 0.284 and weighted average of 13.8%, a difference of 9.0%.
Unemployment Among Ages 20 to 24 years Correlation Summary
| Measurement | Shoshone | Immigrants from Grenada |
| Minimum | 4.3% | 4.8% |
| Maximum | 100.0% | 23.8% |
| Range | 95.7% | 19.0% |
| Mean | 31.7% | 13.0% |
| Median | 17.4% | 12.1% |
| Interquartile 25% (IQ1) | 10.5% | 10.9% |
| Interquartile 75% (IQ3) | 40.0% | 15.5% |
| Interquartile Range (IQR) | 29.5% | 4.6% |
| Standard Deviation (Sample) | 29.7% | 3.8% |
| Standard Deviation (Population) | 29.1% | 3.8% |
Demographics Similar to Shoshone and Immigrants from Grenada by Unemployment Among Ages 20 to 24 years
In terms of unemployment among ages 20 to 24 years, the demographic groups most similar to Shoshone are Black/African American (12.7%, a difference of 0.19%), West Indian (12.8%, a difference of 0.40%), Houma (12.6%, a difference of 0.53%), Immigrants from Dominica (12.8%, a difference of 0.88%), and Immigrants from Trinidad and Tobago (12.8%, a difference of 1.0%). Similarly, the demographic groups most similar to Immigrants from Grenada are Aleut (13.8%, a difference of 0.060%), Arapaho (13.8%, a difference of 0.34%), Dominican (13.8%, a difference of 0.41%), British West Indian (13.7%, a difference of 0.98%), and Immigrants from Dominican Republic (13.6%, a difference of 1.5%).
| Demographics | Rating | Rank | Unemployment Among Ages 20 to 24 years |
| Houma | 0.0 /100 | #312 | Tragic 12.6% |
| Shoshone | 0.0 /100 | #313 | Tragic 12.7% |
| Blacks/African Americans | 0.0 /100 | #314 | Tragic 12.7% |
| West Indians | 0.0 /100 | #315 | Tragic 12.8% |
| Immigrants | Dominica | 0.0 /100 | #316 | Tragic 12.8% |
| Immigrants | Trinidad and Tobago | 0.0 /100 | #317 | Tragic 12.8% |
| Barbadians | 0.0 /100 | #318 | Tragic 12.9% |
| Trinidadians and Tobagonians | 0.0 /100 | #319 | Tragic 12.9% |
| Cheyenne | 0.0 /100 | #320 | Tragic 13.0% |
| Immigrants | Jamaica | 0.0 /100 | #321 | Tragic 13.0% |
| Natives/Alaskans | 0.0 /100 | #322 | Tragic 13.0% |
| Yakama | 0.0 /100 | #323 | Tragic 13.1% |
| Alaska Natives | 0.0 /100 | #324 | Tragic 13.2% |
| Pueblo | 0.0 /100 | #325 | Tragic 13.2% |
| Immigrants | Barbados | 0.0 /100 | #326 | Tragic 13.5% |
| Immigrants | Dominican Republic | 0.0 /100 | #327 | Tragic 13.6% |
| British West Indians | 0.0 /100 | #328 | Tragic 13.7% |
| Dominicans | 0.0 /100 | #329 | Tragic 13.8% |
| Arapaho | 0.0 /100 | #330 | Tragic 13.8% |
| Aleuts | 0.0 /100 | #331 | Tragic 13.8% |
| Immigrants | Grenada | 0.0 /100 | #332 | Tragic 13.8% |