Shoshone vs French Canadian Disability
COMPARE
Shoshone
French Canadian
Disability
Disability Comparison
Shoshone
French Canadians
13.5%
DISABILITY
0.0/ 100
METRIC RATING
307th/ 347
METRIC RANK
13.4%
DISABILITY
0.0/ 100
METRIC RATING
305th/ 347
METRIC RANK
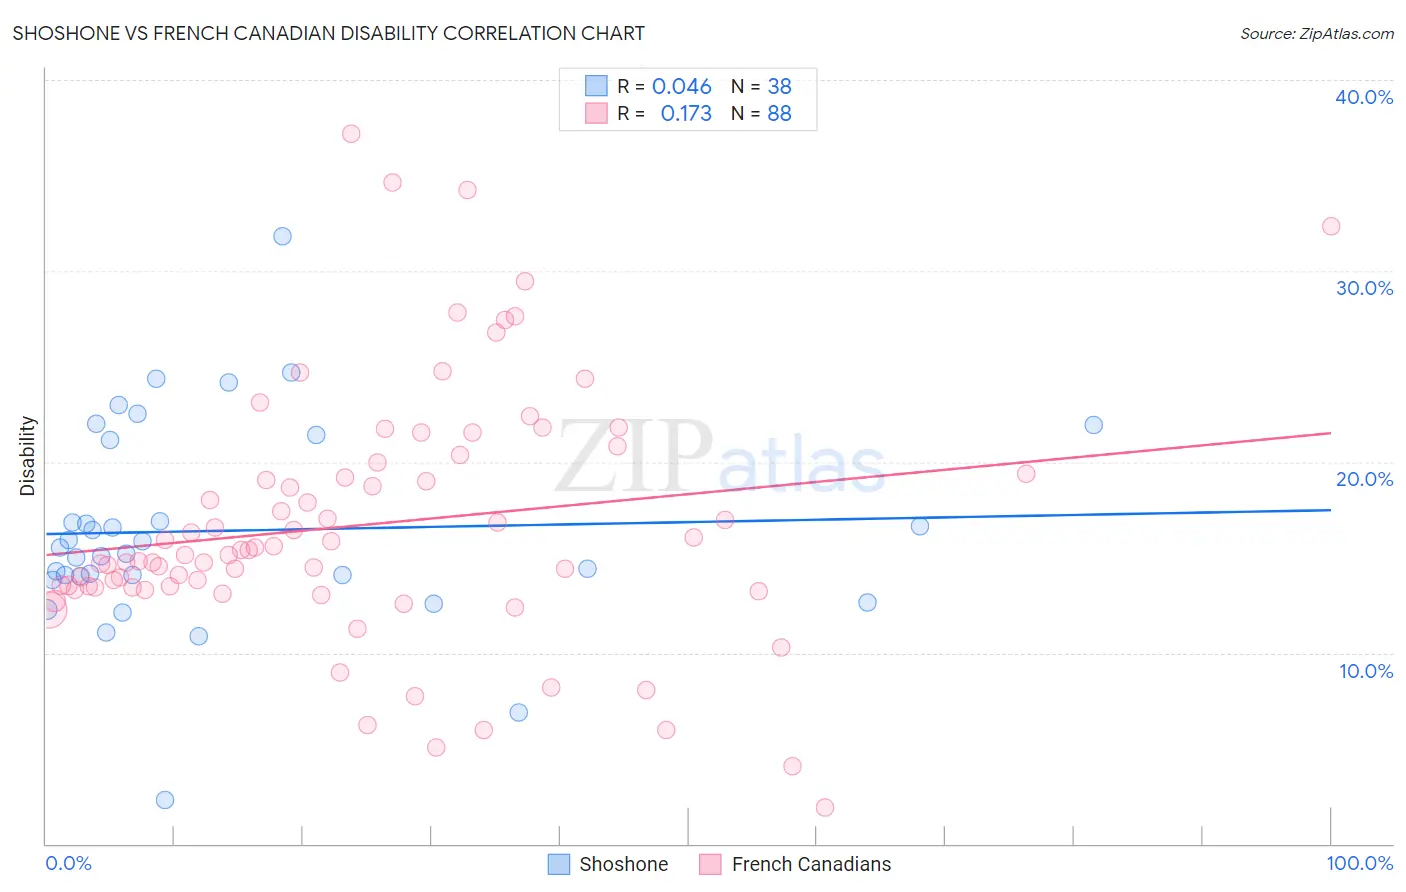
Shoshone vs French Canadian Disability Correlation Chart
The statistical analysis conducted on geographies consisting of 66,619,944 people shows no correlation between the proportion of Shoshone and percentage of population with a disability in the United States with a correlation coefficient (R) of 0.046 and weighted average of 13.5%. Similarly, the statistical analysis conducted on geographies consisting of 502,588,623 people shows a poor positive correlation between the proportion of French Canadians and percentage of population with a disability in the United States with a correlation coefficient (R) of 0.173 and weighted average of 13.4%, a difference of 0.66%.
Disability Correlation Summary
| Measurement | Shoshone | French Canadian |
| Minimum | 2.3% | 1.9% |
| Maximum | 31.8% | 37.2% |
| Range | 29.5% | 35.3% |
| Mean | 16.4% | 16.7% |
| Median | 15.3% | 15.3% |
| Interquartile 25% (IQ1) | 14.0% | 13.4% |
| Interquartile 75% (IQ3) | 21.2% | 19.7% |
| Interquartile Range (IQR) | 7.1% | 6.3% |
| Standard Deviation (Sample) | 5.4% | 6.7% |
| Standard Deviation (Population) | 5.3% | 6.6% |
Demographics Similar to Shoshone and French Canadians by Disability
In terms of disability, the demographic groups most similar to Shoshone are Cape Verdean (13.5%, a difference of 0.050%), French American Indian (13.5%, a difference of 0.090%), Tlingit-Haida (13.5%, a difference of 0.18%), Blackfeet (13.6%, a difference of 0.71%), and Delaware (13.6%, a difference of 0.74%). Similarly, the demographic groups most similar to French Canadians are Yakama (13.4%, a difference of 0.35%), Cape Verdean (13.5%, a difference of 0.61%), French American Indian (13.5%, a difference of 0.75%), Scotch-Irish (13.3%, a difference of 0.81%), and Tlingit-Haida (13.5%, a difference of 0.84%).
| Demographics | Rating | Rank | Disability |
| Central American Indians | 0.0 /100 | #296 | Tragic 13.2% |
| Hopi | 0.0 /100 | #297 | Tragic 13.2% |
| Alaska Natives | 0.0 /100 | #298 | Tragic 13.2% |
| French | 0.0 /100 | #299 | Tragic 13.2% |
| Pennsylvania Germans | 0.0 /100 | #300 | Tragic 13.2% |
| Immigrants | Micronesia | 0.0 /100 | #301 | Tragic 13.2% |
| Arapaho | 0.0 /100 | #302 | Tragic 13.2% |
| Scotch-Irish | 0.0 /100 | #303 | Tragic 13.3% |
| Yakama | 0.0 /100 | #304 | Tragic 13.4% |
| French Canadians | 0.0 /100 | #305 | Tragic 13.4% |
| Cape Verdeans | 0.0 /100 | #306 | Tragic 13.5% |
| Shoshone | 0.0 /100 | #307 | Tragic 13.5% |
| French American Indians | 0.0 /100 | #308 | Tragic 13.5% |
| Tlingit-Haida | 0.0 /100 | #309 | Tragic 13.5% |
| Blackfeet | 0.0 /100 | #310 | Tragic 13.6% |
| Delaware | 0.0 /100 | #311 | Tragic 13.6% |
| Spanish Americans | 0.0 /100 | #312 | Tragic 13.6% |
| Cree | 0.0 /100 | #313 | Tragic 13.7% |
| Blacks/African Americans | 0.0 /100 | #314 | Tragic 13.7% |
| Puget Sound Salish | 0.0 /100 | #315 | Tragic 13.7% |
| Pima | 0.0 /100 | #316 | Tragic 13.7% |