Vietnamese vs South African Self-Care Disability
COMPARE
Vietnamese
South African
Self-Care Disability
Self-Care Disability Comparison
Vietnamese
South Africans
2.6%
SELF-CARE DISABILITY
2.1/ 100
METRIC RATING
234th/ 347
METRIC RANK
2.3%
SELF-CARE DISABILITY
99.3/ 100
METRIC RATING
67th/ 347
METRIC RANK
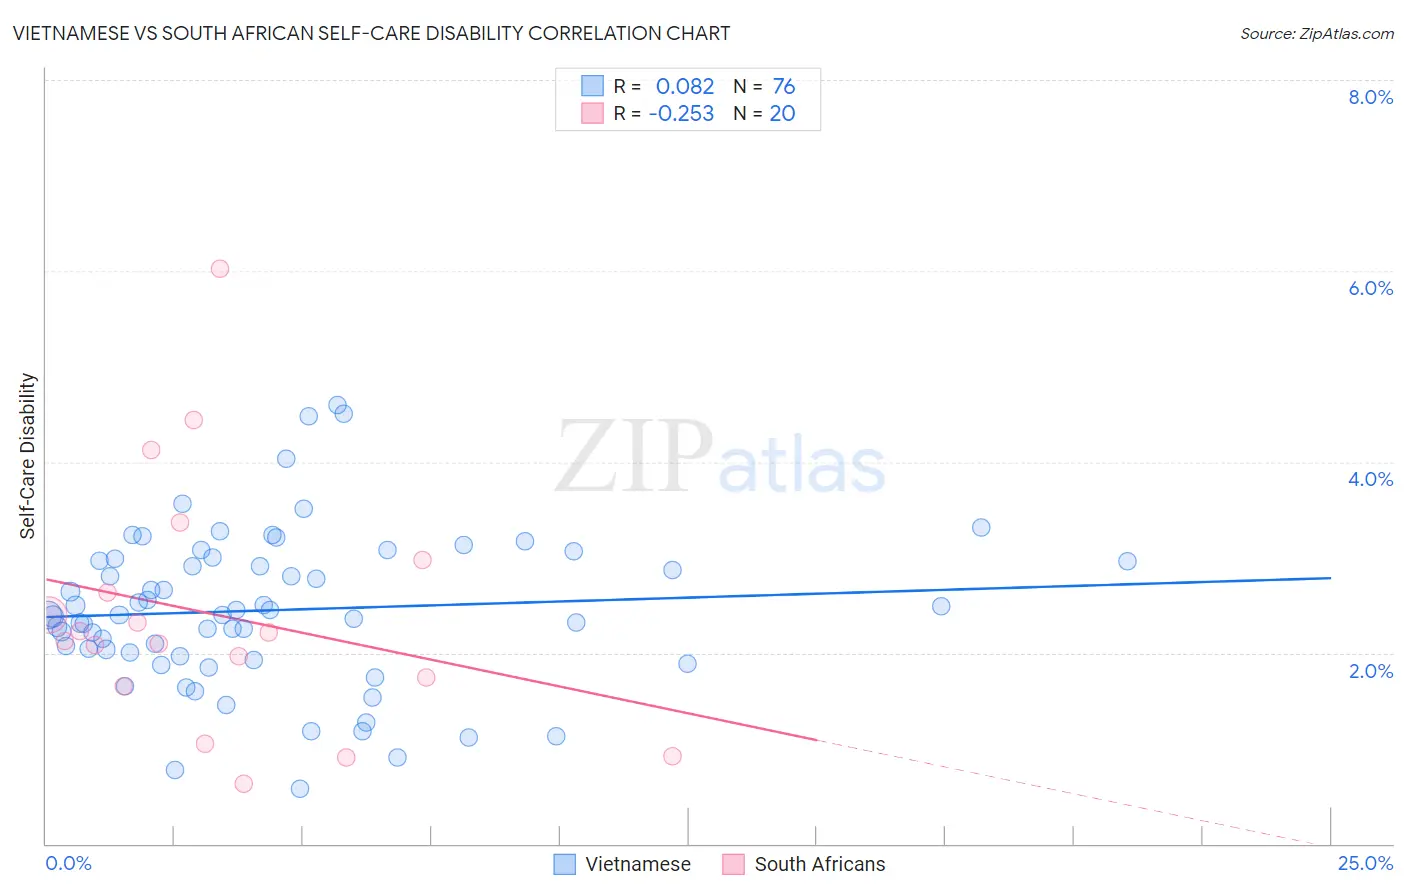
Vietnamese vs South African Self-Care Disability Correlation Chart
The statistical analysis conducted on geographies consisting of 170,626,473 people shows a slight positive correlation between the proportion of Vietnamese and percentage of population with self-care disability in the United States with a correlation coefficient (R) of 0.082 and weighted average of 2.6%. Similarly, the statistical analysis conducted on geographies consisting of 182,494,090 people shows a weak negative correlation between the proportion of South Africans and percentage of population with self-care disability in the United States with a correlation coefficient (R) of -0.253 and weighted average of 2.3%, a difference of 11.1%.
Self-Care Disability Correlation Summary
| Measurement | Vietnamese | South African |
| Minimum | 0.58% | 0.63% |
| Maximum | 4.6% | 6.0% |
| Range | 4.0% | 5.4% |
| Mean | 2.4% | 2.4% |
| Median | 2.4% | 2.2% |
| Interquartile 25% (IQ1) | 2.0% | 1.7% |
| Interquartile 75% (IQ3) | 3.0% | 2.8% |
| Interquartile Range (IQR) | 0.99% | 1.1% |
| Standard Deviation (Sample) | 0.82% | 1.3% |
| Standard Deviation (Population) | 0.81% | 1.3% |
Similar Demographics by Self-Care Disability
Demographics Similar to Vietnamese by Self-Care Disability
In terms of self-care disability, the demographic groups most similar to Vietnamese are Liberian (2.6%, a difference of 0.010%), Bahamian (2.6%, a difference of 0.040%), Albanian (2.6%, a difference of 0.050%), Immigrants from Guatemala (2.6%, a difference of 0.070%), and Bermudan (2.6%, a difference of 0.10%).
| Demographics | Rating | Rank | Self-Care Disability |
| Immigrants | Philippines | 2.7 /100 | #227 | Tragic 2.6% |
| Guatemalans | 2.7 /100 | #228 | Tragic 2.6% |
| Guamanians/Chamorros | 2.5 /100 | #229 | Tragic 2.6% |
| Immigrants | Ecuador | 2.5 /100 | #230 | Tragic 2.6% |
| Immigrants | Guatemala | 2.2 /100 | #231 | Tragic 2.6% |
| Albanians | 2.2 /100 | #232 | Tragic 2.6% |
| Liberians | 2.1 /100 | #233 | Tragic 2.6% |
| Vietnamese | 2.1 /100 | #234 | Tragic 2.6% |
| Bahamians | 2.0 /100 | #235 | Tragic 2.6% |
| Bermudans | 1.9 /100 | #236 | Tragic 2.6% |
| Immigrants | Senegal | 1.6 /100 | #237 | Tragic 2.6% |
| Senegalese | 1.3 /100 | #238 | Tragic 2.6% |
| Immigrants | Panama | 1.2 /100 | #239 | Tragic 2.6% |
| Marshallese | 1.2 /100 | #240 | Tragic 2.6% |
| Immigrants | Syria | 1.0 /100 | #241 | Tragic 2.6% |
Demographics Similar to South Africans by Self-Care Disability
In terms of self-care disability, the demographic groups most similar to South Africans are Immigrants from Argentina (2.3%, a difference of 0.030%), Brazilian (2.3%, a difference of 0.060%), Immigrants from Zaire (2.3%, a difference of 0.090%), Immigrants from Norway (2.3%, a difference of 0.090%), and Swedish (2.3%, a difference of 0.12%).
| Demographics | Rating | Rank | Self-Care Disability |
| Immigrants | Japan | 99.5 /100 | #60 | Exceptional 2.3% |
| Palestinians | 99.4 /100 | #61 | Exceptional 2.3% |
| Egyptians | 99.4 /100 | #62 | Exceptional 2.3% |
| Mongolians | 99.3 /100 | #63 | Exceptional 2.3% |
| Swedes | 99.3 /100 | #64 | Exceptional 2.3% |
| Brazilians | 99.3 /100 | #65 | Exceptional 2.3% |
| Immigrants | Argentina | 99.3 /100 | #66 | Exceptional 2.3% |
| South Africans | 99.3 /100 | #67 | Exceptional 2.3% |
| Immigrants | Zaire | 99.2 /100 | #68 | Exceptional 2.3% |
| Immigrants | Norway | 99.2 /100 | #69 | Exceptional 2.3% |
| Immigrants | Northern Europe | 99.2 /100 | #70 | Exceptional 2.3% |
| Asians | 99.2 /100 | #71 | Exceptional 2.3% |
| Eastern Europeans | 99.2 /100 | #72 | Exceptional 2.3% |
| Immigrants | Egypt | 99.1 /100 | #73 | Exceptional 2.3% |
| Immigrants | Switzerland | 99.1 /100 | #74 | Exceptional 2.3% |