Northern European vs Nonimmigrants Female Disability
COMPARE
Northern European
Nonimmigrants
Female Disability
Female Disability Comparison
Northern Europeans
Nonimmigrants
12.3%
FEMALE DISABILITY
27.5/ 100
METRIC RATING
193rd/ 347
METRIC RANK
13.4%
FEMALE DISABILITY
0.0/ 100
METRIC RATING
298th/ 347
METRIC RANK
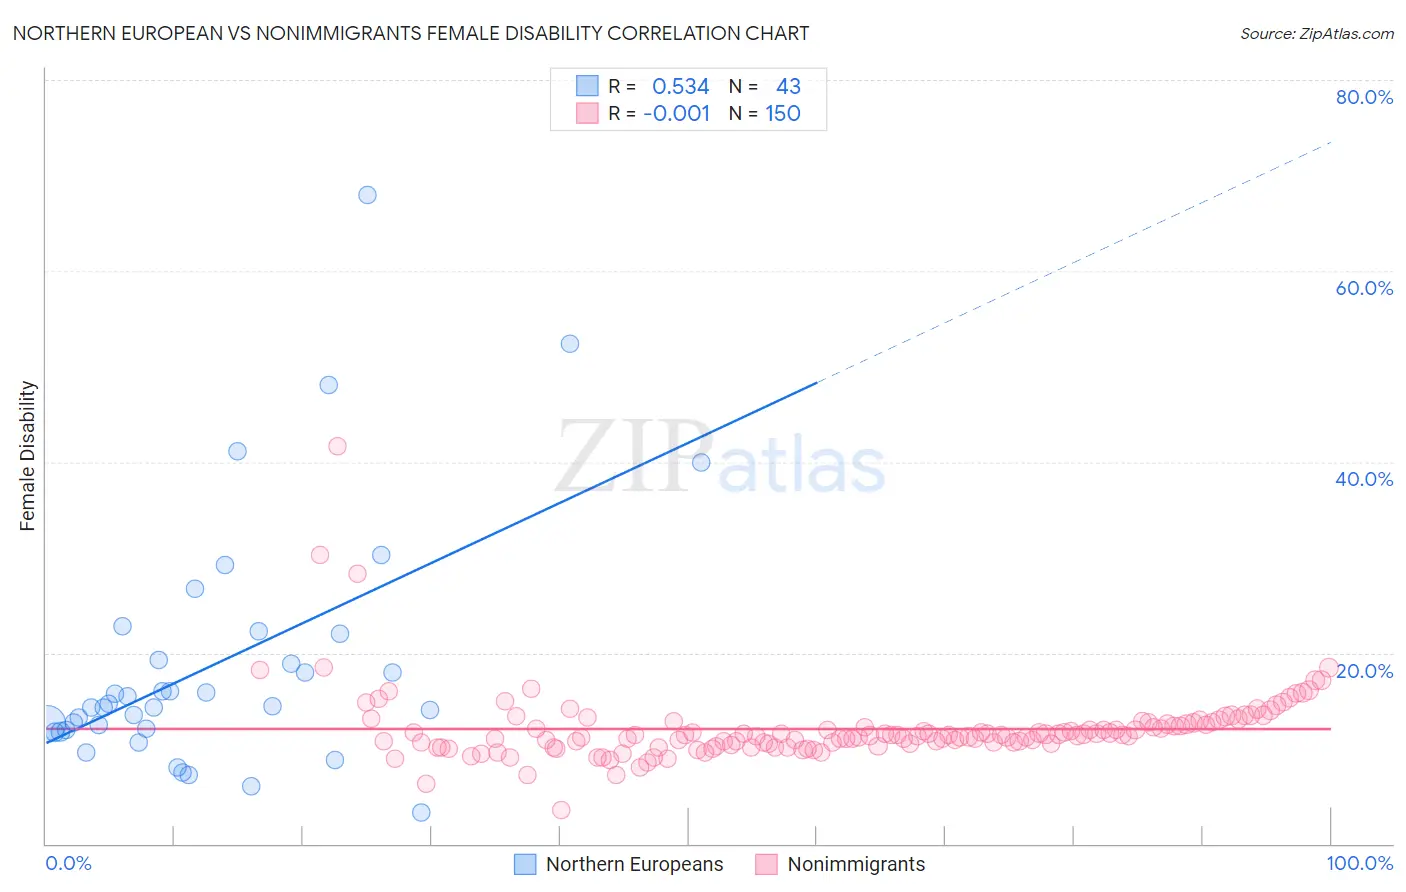
Northern European vs Nonimmigrants Female Disability Correlation Chart
The statistical analysis conducted on geographies consisting of 406,028,817 people shows a substantial positive correlation between the proportion of Northern Europeans and percentage of females with a disability in the United States with a correlation coefficient (R) of 0.534 and weighted average of 12.3%. Similarly, the statistical analysis conducted on geographies consisting of 584,611,893 people shows no correlation between the proportion of Nonimmigrants and percentage of females with a disability in the United States with a correlation coefficient (R) of -0.001 and weighted average of 13.4%, a difference of 8.6%.
Female Disability Correlation Summary
| Measurement | Northern European | Nonimmigrants |
| Minimum | 3.3% | 3.5% |
| Maximum | 68.0% | 41.7% |
| Range | 64.7% | 38.2% |
| Mean | 18.9% | 12.0% |
| Median | 14.4% | 11.4% |
| Interquartile 25% (IQ1) | 12.0% | 10.4% |
| Interquartile 75% (IQ3) | 22.0% | 12.7% |
| Interquartile Range (IQR) | 10.0% | 2.2% |
| Standard Deviation (Sample) | 13.1% | 3.9% |
| Standard Deviation (Population) | 13.0% | 3.8% |
Similar Demographics by Female Disability
Demographics Similar to Northern Europeans by Female Disability
In terms of female disability, the demographic groups most similar to Northern Europeans are Ukrainian (12.3%, a difference of 0.010%), Swedish (12.3%, a difference of 0.040%), Immigrants from Western Africa (12.3%, a difference of 0.080%), Armenian (12.3%, a difference of 0.10%), and Immigrants from Panama (12.3%, a difference of 0.10%).
| Demographics | Rating | Rank | Female Disability |
| Austrians | 33.3 /100 | #186 | Fair 12.3% |
| Serbians | 33.1 /100 | #187 | Fair 12.3% |
| Immigrants | North America | 32.8 /100 | #188 | Fair 12.3% |
| Immigrants | Albania | 31.6 /100 | #189 | Fair 12.3% |
| Immigrants | Honduras | 31.3 /100 | #190 | Fair 12.3% |
| Armenians | 29.7 /100 | #191 | Fair 12.3% |
| Immigrants | Western Africa | 29.2 /100 | #192 | Fair 12.3% |
| Northern Europeans | 27.5 /100 | #193 | Fair 12.3% |
| Ukrainians | 27.2 /100 | #194 | Fair 12.3% |
| Swedes | 26.6 /100 | #195 | Fair 12.3% |
| Immigrants | Panama | 25.5 /100 | #196 | Fair 12.3% |
| Hondurans | 25.4 /100 | #197 | Fair 12.3% |
| Mexican American Indians | 24.9 /100 | #198 | Fair 12.3% |
| Immigrants | Trinidad and Tobago | 24.7 /100 | #199 | Fair 12.3% |
| Trinidadians and Tobagonians | 22.4 /100 | #200 | Fair 12.3% |
Demographics Similar to Nonimmigrants by Female Disability
In terms of female disability, the demographic groups most similar to Nonimmigrants are Immigrants from Dominican Republic (13.4%, a difference of 0.26%), Pennsylvania German (13.4%, a difference of 0.27%), Slovak (13.3%, a difference of 0.30%), Nepalese (13.3%, a difference of 0.34%), and French (13.3%, a difference of 0.47%).
| Demographics | Rating | Rank | Female Disability |
| Shoshone | 0.0 /100 | #291 | Tragic 13.2% |
| Yakama | 0.0 /100 | #292 | Tragic 13.2% |
| Marshallese | 0.0 /100 | #293 | Tragic 13.3% |
| Celtics | 0.0 /100 | #294 | Tragic 13.3% |
| French | 0.0 /100 | #295 | Tragic 13.3% |
| Nepalese | 0.0 /100 | #296 | Tragic 13.3% |
| Slovaks | 0.0 /100 | #297 | Tragic 13.3% |
| Immigrants | Nonimmigrants | 0.0 /100 | #298 | Tragic 13.4% |
| Immigrants | Dominican Republic | 0.0 /100 | #299 | Tragic 13.4% |
| Pennsylvania Germans | 0.0 /100 | #300 | Tragic 13.4% |
| Africans | 0.0 /100 | #301 | Tragic 13.4% |
| Scotch-Irish | 0.0 /100 | #302 | Tragic 13.4% |
| Immigrants | Portugal | 0.0 /100 | #303 | Tragic 13.5% |
| Immigrants | Micronesia | 0.0 /100 | #304 | Tragic 13.5% |
| Dominicans | 0.0 /100 | #305 | Tragic 13.5% |