Scottish vs Alaska Native Female Disability
COMPARE
Scottish
Alaska Native
Female Disability
Female Disability Comparison
Scottish
Alaska Natives
13.0%
FEMALE DISABILITY
0.1/ 100
METRIC RATING
278th/ 347
METRIC RANK
12.8%
FEMALE DISABILITY
0.6/ 100
METRIC RATING
264th/ 347
METRIC RANK
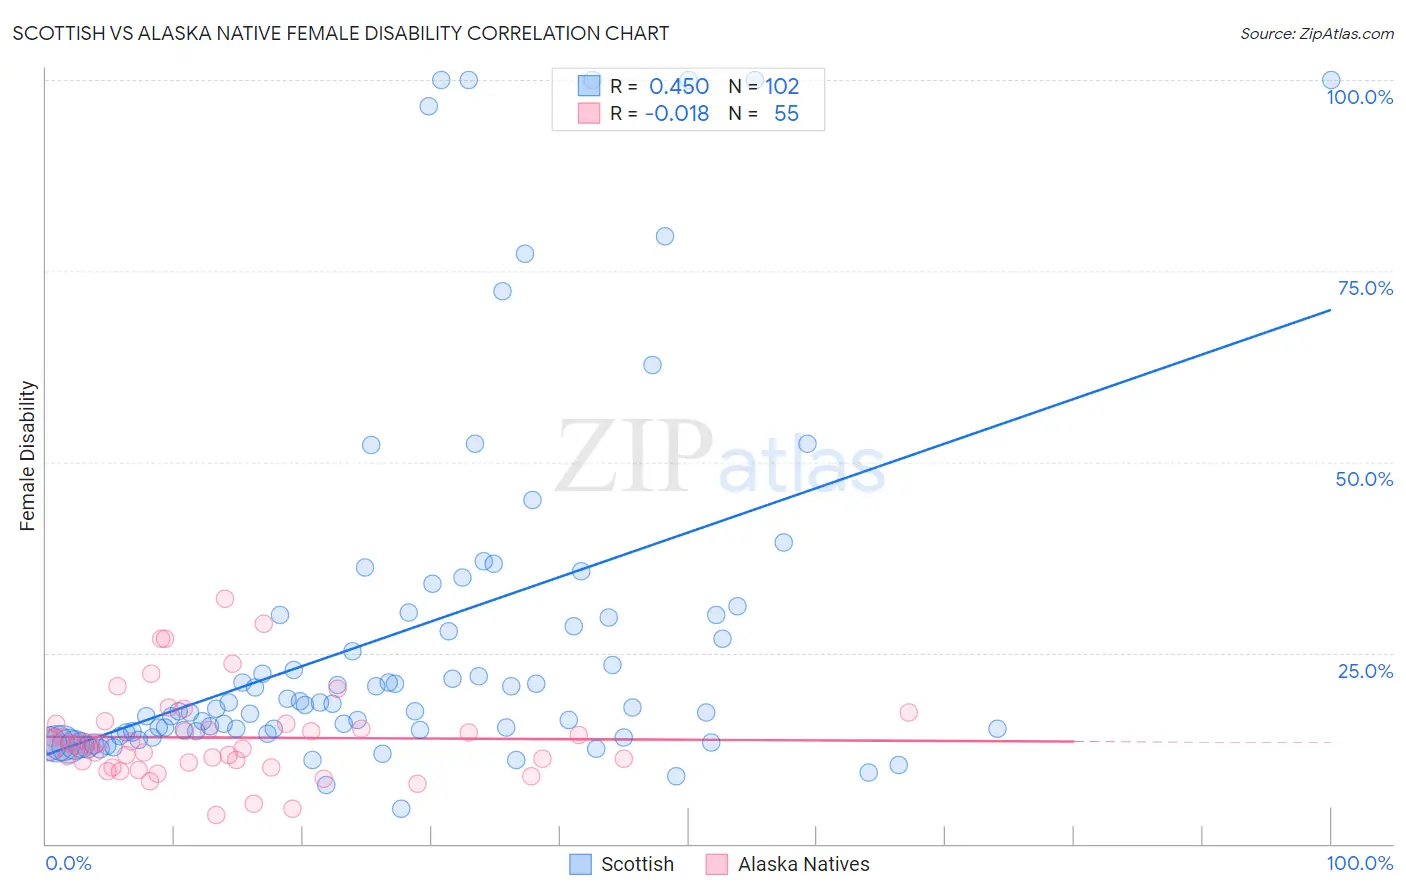
Scottish vs Alaska Native Female Disability Correlation Chart
The statistical analysis conducted on geographies consisting of 566,851,987 people shows a moderate positive correlation between the proportion of Scottish and percentage of females with a disability in the United States with a correlation coefficient (R) of 0.450 and weighted average of 13.0%. Similarly, the statistical analysis conducted on geographies consisting of 76,769,198 people shows no correlation between the proportion of Alaska Natives and percentage of females with a disability in the United States with a correlation coefficient (R) of -0.018 and weighted average of 12.8%, a difference of 1.8%.
Female Disability Correlation Summary
| Measurement | Scottish | Alaska Native |
| Minimum | 4.6% | 3.8% |
| Maximum | 100.0% | 32.1% |
| Range | 95.4% | 28.4% |
| Mean | 27.6% | 13.9% |
| Median | 17.8% | 12.9% |
| Interquartile 25% (IQ1) | 14.4% | 10.7% |
| Interquartile 75% (IQ3) | 30.0% | 15.7% |
| Interquartile Range (IQR) | 15.6% | 5.0% |
| Standard Deviation (Sample) | 24.0% | 5.7% |
| Standard Deviation (Population) | 23.9% | 5.7% |
Demographics Similar to Scottish and Alaska Natives by Female Disability
In terms of female disability, the demographic groups most similar to Scottish are Spanish (13.0%, a difference of 0.080%), Arapaho (13.0%, a difference of 0.24%), Immigrants from Dominica (13.0%, a difference of 0.28%), Irish (13.1%, a difference of 0.33%), and Cheyenne (13.0%, a difference of 0.34%). Similarly, the demographic groups most similar to Alaska Natives are Spaniard (12.8%, a difference of 0.12%), West Indian (12.8%, a difference of 0.19%), Finnish (12.8%, a difference of 0.31%), Senegalese (12.8%, a difference of 0.32%), and Czechoslovakian (12.7%, a difference of 0.35%).
| Demographics | Rating | Rank | Female Disability |
| Bermudans | 1.0 /100 | #261 | Tragic 12.7% |
| Czechoslovakians | 0.9 /100 | #262 | Tragic 12.7% |
| Spaniards | 0.7 /100 | #263 | Tragic 12.8% |
| Alaska Natives | 0.6 /100 | #264 | Tragic 12.8% |
| West Indians | 0.5 /100 | #265 | Tragic 12.8% |
| Finns | 0.4 /100 | #266 | Tragic 12.8% |
| Senegalese | 0.4 /100 | #267 | Tragic 12.8% |
| Immigrants | Laos | 0.4 /100 | #268 | Tragic 12.8% |
| Indonesians | 0.4 /100 | #269 | Tragic 12.8% |
| Immigrants | Liberia | 0.3 /100 | #270 | Tragic 12.9% |
| Dutch | 0.2 /100 | #271 | Tragic 12.9% |
| Germans | 0.1 /100 | #272 | Tragic 12.9% |
| Sioux | 0.1 /100 | #273 | Tragic 12.9% |
| Portuguese | 0.1 /100 | #274 | Tragic 13.0% |
| Cheyenne | 0.1 /100 | #275 | Tragic 13.0% |
| Immigrants | Dominica | 0.1 /100 | #276 | Tragic 13.0% |
| Spanish | 0.1 /100 | #277 | Tragic 13.0% |
| Scottish | 0.1 /100 | #278 | Tragic 13.0% |
| Arapaho | 0.1 /100 | #279 | Tragic 13.0% |
| Irish | 0.1 /100 | #280 | Tragic 13.1% |
| U.S. Virgin Islanders | 0.1 /100 | #281 | Tragic 13.1% |