Scottish vs Immigrants from Asia Female Disability
COMPARE
Scottish
Immigrants from Asia
Female Disability
Female Disability Comparison
Scottish
Immigrants from Asia
13.0%
FEMALE DISABILITY
0.1/ 100
METRIC RATING
278th/ 347
METRIC RANK
11.0%
FEMALE DISABILITY
100.0/ 100
METRIC RATING
25th/ 347
METRIC RANK
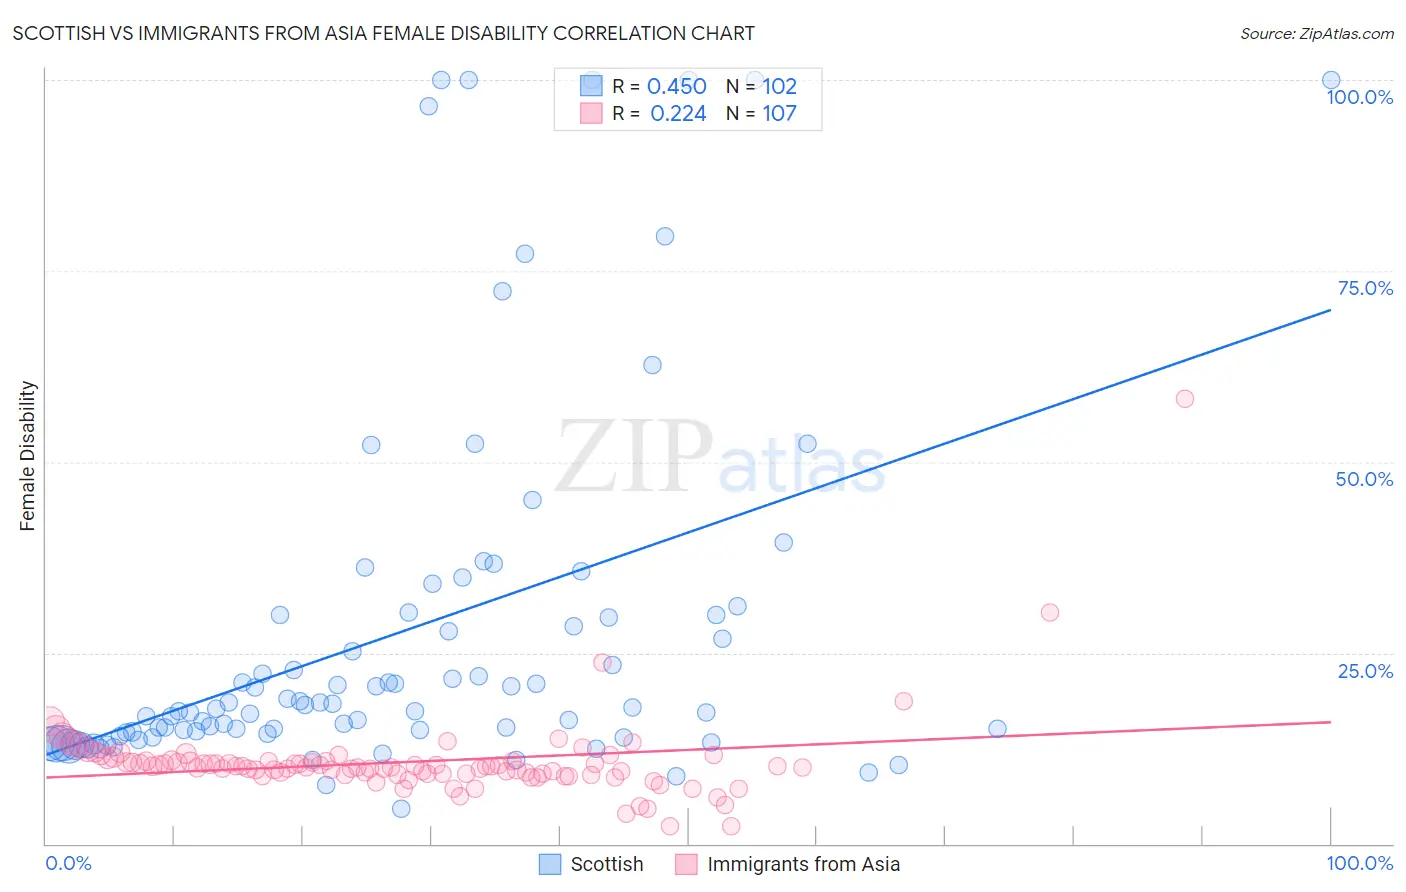
Scottish vs Immigrants from Asia Female Disability Correlation Chart
The statistical analysis conducted on geographies consisting of 566,851,987 people shows a moderate positive correlation between the proportion of Scottish and percentage of females with a disability in the United States with a correlation coefficient (R) of 0.450 and weighted average of 13.0%. Similarly, the statistical analysis conducted on geographies consisting of 548,970,010 people shows a weak positive correlation between the proportion of Immigrants from Asia and percentage of females with a disability in the United States with a correlation coefficient (R) of 0.224 and weighted average of 11.0%, a difference of 18.1%.
Female Disability Correlation Summary
| Measurement | Scottish | Immigrants from Asia |
| Minimum | 4.6% | 2.2% |
| Maximum | 100.0% | 58.2% |
| Range | 95.4% | 56.0% |
| Mean | 27.6% | 10.7% |
| Median | 17.8% | 10.1% |
| Interquartile 25% (IQ1) | 14.4% | 9.2% |
| Interquartile 75% (IQ3) | 30.0% | 10.8% |
| Interquartile Range (IQR) | 15.6% | 1.7% |
| Standard Deviation (Sample) | 24.0% | 5.7% |
| Standard Deviation (Population) | 23.9% | 5.7% |
Similar Demographics by Female Disability
Demographics Similar to Scottish by Female Disability
In terms of female disability, the demographic groups most similar to Scottish are Spanish (13.0%, a difference of 0.080%), Arapaho (13.0%, a difference of 0.24%), Immigrants from Dominica (13.0%, a difference of 0.28%), Irish (13.1%, a difference of 0.33%), and Cheyenne (13.0%, a difference of 0.34%).
| Demographics | Rating | Rank | Female Disability |
| Dutch | 0.2 /100 | #271 | Tragic 12.9% |
| Germans | 0.1 /100 | #272 | Tragic 12.9% |
| Sioux | 0.1 /100 | #273 | Tragic 12.9% |
| Portuguese | 0.1 /100 | #274 | Tragic 13.0% |
| Cheyenne | 0.1 /100 | #275 | Tragic 13.0% |
| Immigrants | Dominica | 0.1 /100 | #276 | Tragic 13.0% |
| Spanish | 0.1 /100 | #277 | Tragic 13.0% |
| Scottish | 0.1 /100 | #278 | Tragic 13.0% |
| Arapaho | 0.1 /100 | #279 | Tragic 13.0% |
| Irish | 0.1 /100 | #280 | Tragic 13.1% |
| U.S. Virgin Islanders | 0.1 /100 | #281 | Tragic 13.1% |
| Welsh | 0.0 /100 | #282 | Tragic 13.1% |
| English | 0.0 /100 | #283 | Tragic 13.1% |
| Hmong | 0.0 /100 | #284 | Tragic 13.1% |
| Bangladeshis | 0.0 /100 | #285 | Tragic 13.1% |
Demographics Similar to Immigrants from Asia by Female Disability
In terms of female disability, the demographic groups most similar to Immigrants from Asia are Immigrants from Argentina (11.0%, a difference of 0.030%), Argentinean (11.0%, a difference of 0.040%), Immigrants from Turkey (11.1%, a difference of 0.44%), Venezuelan (11.0%, a difference of 0.59%), and Egyptian (11.1%, a difference of 0.72%).
| Demographics | Rating | Rank | Female Disability |
| Immigrants | Iran | 100.0 /100 | #18 | Exceptional 10.8% |
| Immigrants | Venezuela | 100.0 /100 | #19 | Exceptional 10.9% |
| Immigrants | Pakistan | 100.0 /100 | #20 | Exceptional 10.9% |
| Asians | 100.0 /100 | #21 | Exceptional 10.9% |
| Immigrants | Sri Lanka | 100.0 /100 | #22 | Exceptional 10.9% |
| Venezuelans | 100.0 /100 | #23 | Exceptional 11.0% |
| Immigrants | Argentina | 100.0 /100 | #24 | Exceptional 11.0% |
| Immigrants | Asia | 100.0 /100 | #25 | Exceptional 11.0% |
| Argentineans | 100.0 /100 | #26 | Exceptional 11.0% |
| Immigrants | Turkey | 100.0 /100 | #27 | Exceptional 11.1% |
| Egyptians | 100.0 /100 | #28 | Exceptional 11.1% |
| Immigrants | Malaysia | 100.0 /100 | #29 | Exceptional 11.1% |
| Turks | 100.0 /100 | #30 | Exceptional 11.1% |
| Immigrants | Kuwait | 100.0 /100 | #31 | Exceptional 11.1% |
| Immigrants | Australia | 100.0 /100 | #32 | Exceptional 11.1% |