Cypriot vs Nonimmigrants Female Disability
COMPARE
Cypriot
Nonimmigrants
Female Disability
Female Disability Comparison
Cypriots
Nonimmigrants
11.2%
FEMALE DISABILITY
100.0/ 100
METRIC RATING
36th/ 347
METRIC RANK
13.4%
FEMALE DISABILITY
0.0/ 100
METRIC RATING
298th/ 347
METRIC RANK
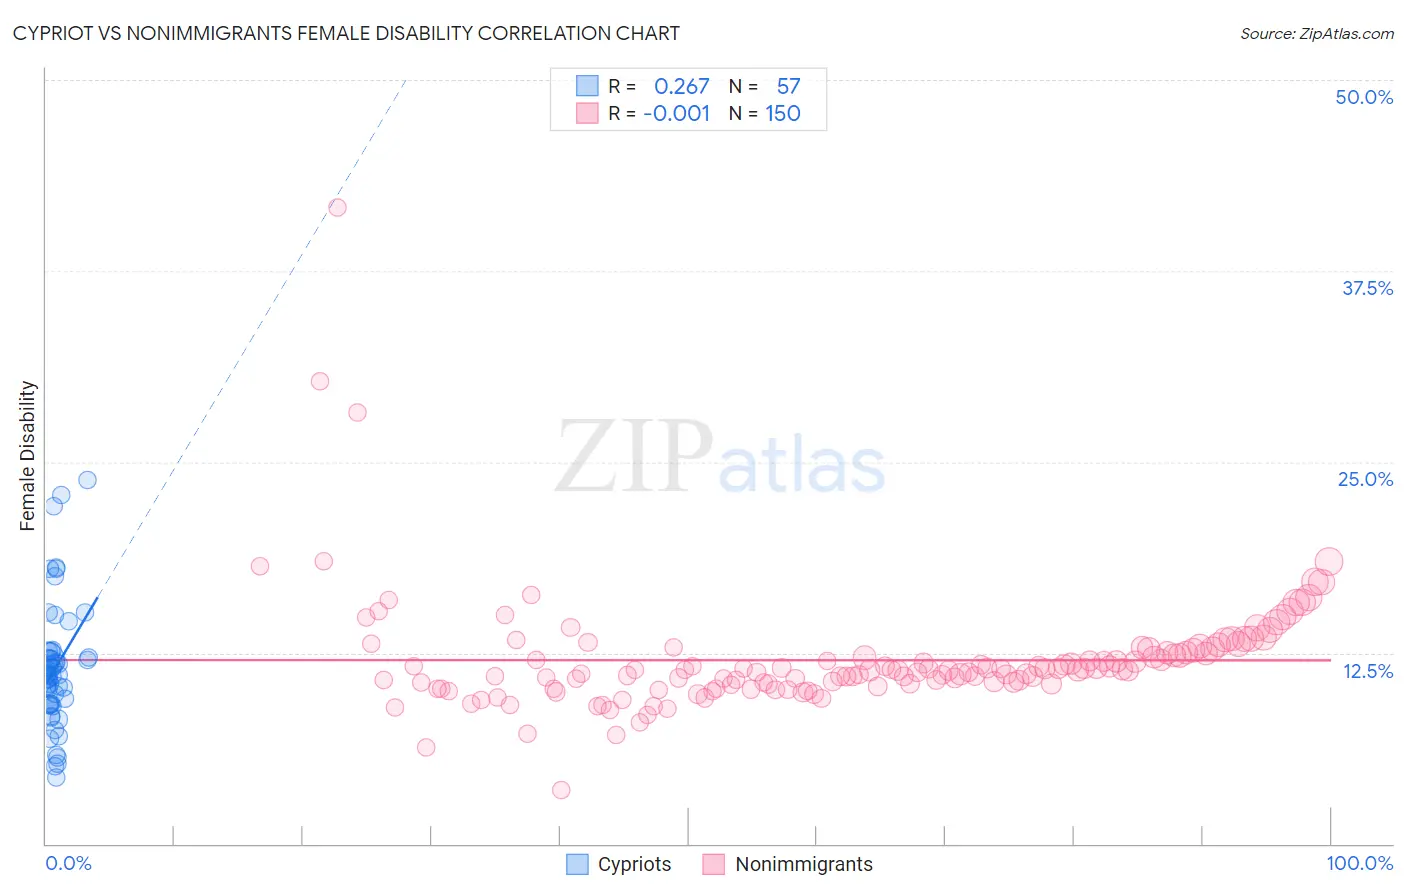
Cypriot vs Nonimmigrants Female Disability Correlation Chart
The statistical analysis conducted on geographies consisting of 61,870,589 people shows a weak positive correlation between the proportion of Cypriots and percentage of females with a disability in the United States with a correlation coefficient (R) of 0.267 and weighted average of 11.2%. Similarly, the statistical analysis conducted on geographies consisting of 584,611,893 people shows no correlation between the proportion of Nonimmigrants and percentage of females with a disability in the United States with a correlation coefficient (R) of -0.001 and weighted average of 13.4%, a difference of 19.4%.
Female Disability Correlation Summary
| Measurement | Cypriot | Nonimmigrants |
| Minimum | 4.4% | 3.5% |
| Maximum | 23.8% | 41.7% |
| Range | 19.4% | 38.2% |
| Mean | 11.5% | 12.0% |
| Median | 11.1% | 11.4% |
| Interquartile 25% (IQ1) | 9.1% | 10.4% |
| Interquartile 75% (IQ3) | 12.4% | 12.7% |
| Interquartile Range (IQR) | 3.3% | 2.2% |
| Standard Deviation (Sample) | 4.1% | 3.9% |
| Standard Deviation (Population) | 4.1% | 3.8% |
Similar Demographics by Female Disability
Demographics Similar to Cypriots by Female Disability
In terms of female disability, the demographic groups most similar to Cypriots are Ethiopian (11.2%, a difference of 0.010%), Immigrants from Ethiopia (11.2%, a difference of 0.040%), Immigrants from Japan (11.2%, a difference of 0.070%), Immigrants from Indonesia (11.2%, a difference of 0.21%), and Immigrants from Lithuania (11.2%, a difference of 0.25%).
| Demographics | Rating | Rank | Female Disability |
| Immigrants | Malaysia | 100.0 /100 | #29 | Exceptional 11.1% |
| Turks | 100.0 /100 | #30 | Exceptional 11.1% |
| Immigrants | Kuwait | 100.0 /100 | #31 | Exceptional 11.1% |
| Immigrants | Australia | 100.0 /100 | #32 | Exceptional 11.1% |
| Immigrants | Egypt | 100.0 /100 | #33 | Exceptional 11.1% |
| Immigrants | Indonesia | 100.0 /100 | #34 | Exceptional 11.2% |
| Immigrants | Japan | 100.0 /100 | #35 | Exceptional 11.2% |
| Cypriots | 100.0 /100 | #36 | Exceptional 11.2% |
| Ethiopians | 100.0 /100 | #37 | Exceptional 11.2% |
| Immigrants | Ethiopia | 100.0 /100 | #38 | Exceptional 11.2% |
| Immigrants | Lithuania | 100.0 /100 | #39 | Exceptional 11.2% |
| Mongolians | 100.0 /100 | #40 | Exceptional 11.2% |
| Paraguayans | 100.0 /100 | #41 | Exceptional 11.2% |
| Israelis | 100.0 /100 | #42 | Exceptional 11.2% |
| Afghans | 100.0 /100 | #43 | Exceptional 11.2% |
Demographics Similar to Nonimmigrants by Female Disability
In terms of female disability, the demographic groups most similar to Nonimmigrants are Immigrants from Dominican Republic (13.4%, a difference of 0.26%), Pennsylvania German (13.4%, a difference of 0.27%), Slovak (13.3%, a difference of 0.30%), Nepalese (13.3%, a difference of 0.34%), and French (13.3%, a difference of 0.47%).
| Demographics | Rating | Rank | Female Disability |
| Shoshone | 0.0 /100 | #291 | Tragic 13.2% |
| Yakama | 0.0 /100 | #292 | Tragic 13.2% |
| Marshallese | 0.0 /100 | #293 | Tragic 13.3% |
| Celtics | 0.0 /100 | #294 | Tragic 13.3% |
| French | 0.0 /100 | #295 | Tragic 13.3% |
| Nepalese | 0.0 /100 | #296 | Tragic 13.3% |
| Slovaks | 0.0 /100 | #297 | Tragic 13.3% |
| Immigrants | Nonimmigrants | 0.0 /100 | #298 | Tragic 13.4% |
| Immigrants | Dominican Republic | 0.0 /100 | #299 | Tragic 13.4% |
| Pennsylvania Germans | 0.0 /100 | #300 | Tragic 13.4% |
| Africans | 0.0 /100 | #301 | Tragic 13.4% |
| Scotch-Irish | 0.0 /100 | #302 | Tragic 13.4% |
| Immigrants | Portugal | 0.0 /100 | #303 | Tragic 13.5% |
| Immigrants | Micronesia | 0.0 /100 | #304 | Tragic 13.5% |
| Dominicans | 0.0 /100 | #305 | Tragic 13.5% |